

Question: Problem 4 . The Eutectic Phase Diagram Figures 1 1 - 6 and 1 1 - 1 8 show the lead - tin phase diagram
Problem The Eutectic Phase Diagram
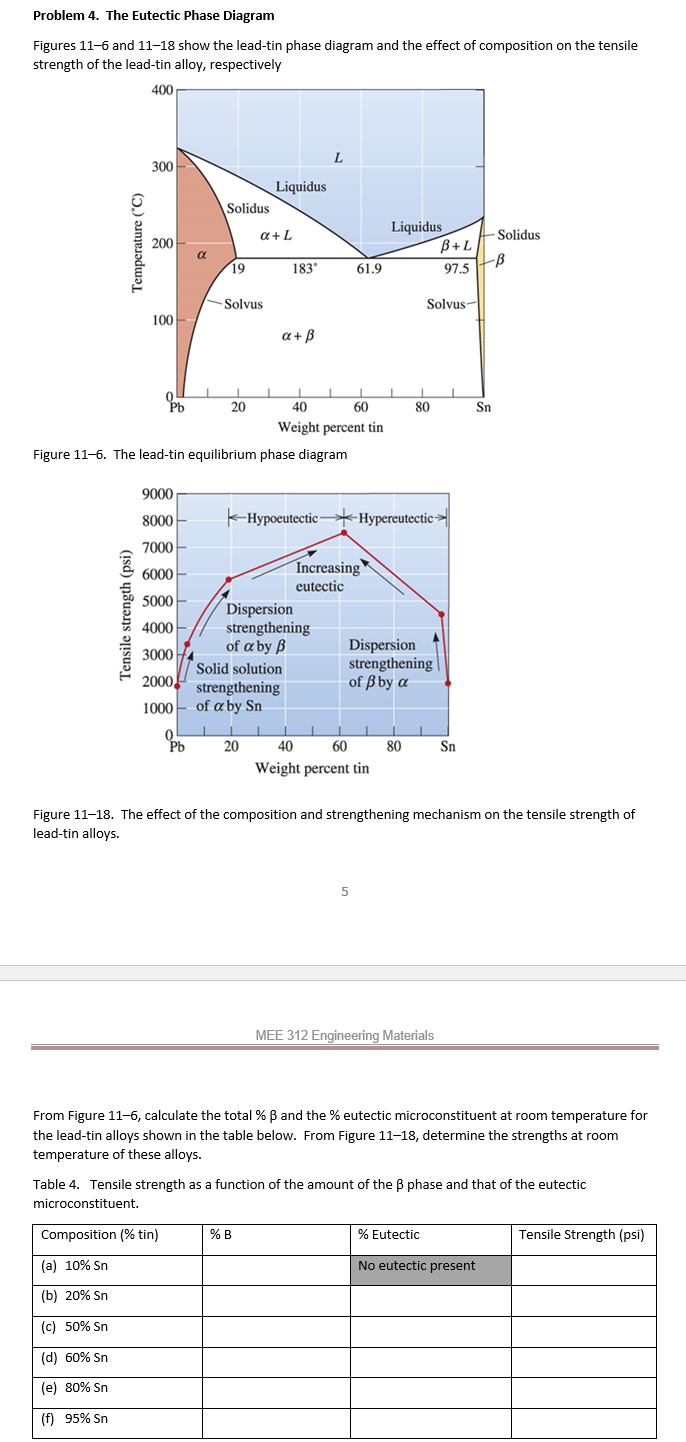
Figures and show the leadtin phase diagram and the effect of composition on the tensile strength of the leadtin alloy, respectively
Figure The leadtin equilibrium phase diagram
Figure The effect of the composition and strengthening mechanism on the tensile strength of leadtin alloys.
From Figure calculate the total beta and the eutectic microconstituent at room temperature for the leadtin alloys shown in the table below. From Figure determine the strengths at room temperature of these alloys.
Table Tensile strength as a function of the amount of the beta phase and that of the eutectic microconstituent.
Step by Step Solution
There are 3 Steps involved in it
1 Expert Approved Answer
Step: 1 Unlock

Question Has Been Solved by an Expert!
Get step-by-step solutions from verified subject matter experts
Step: 2 Unlock
Step: 3 Unlock