

Question: Project VESE (very expensive seismic experiment) deployed 60 seismometers in a linear array extending 240 km away from a large surface explosion. Despite careful picking
Project VESE (very expensive seismic experiment) deployed 60 seismometers in a linear array extending 240 km away from a large surface explosion. Despite careful picking of the resulting seismograms, the first-arrival P -wave travel times (plotted in Fig. 5.16 and also given in the supplemental web material) show considerable scatter. Fit these points with a series of straight lines and compute the ray parameter p and the delay time ? for each line. The first of these lines should go through the origin (zero time and range). Be sure to take into account the reduction velocity of 8 km/s in computing p . Using equation (5.12), invert these results for a layer-cake P -velocity model of the crust and uppermost mantle. List your model in a table, starting with the surface layer and continuing downward, with each line consisting of a depth (km) and a velocity (km/s). Specify the velocity discontinuities between layers by listing the depth twice, with the first line containing the velocity in the upper layer and the second line the lower layer velocity. Make sure that the first column of your table is absolute depth and not layer thickness. For example, a three-layer model with a 2 km thick top layer of 4 km/s, a 4 km thick middle layer of 6 km/s, and a bottom layer of 8.1 km/s would be written as: 0.0 4.0 2.0 4.0 2.0 6.0 6.0 6.0 6.0 8.1 What is the Pn crossover distance? How thick is the crust in your model? How much uncertainty would you assign to your crustal thickness estimate? Note: Not everyone will get the same answer to this exercise! It?s fun to plot the different models to see how well they agree.?
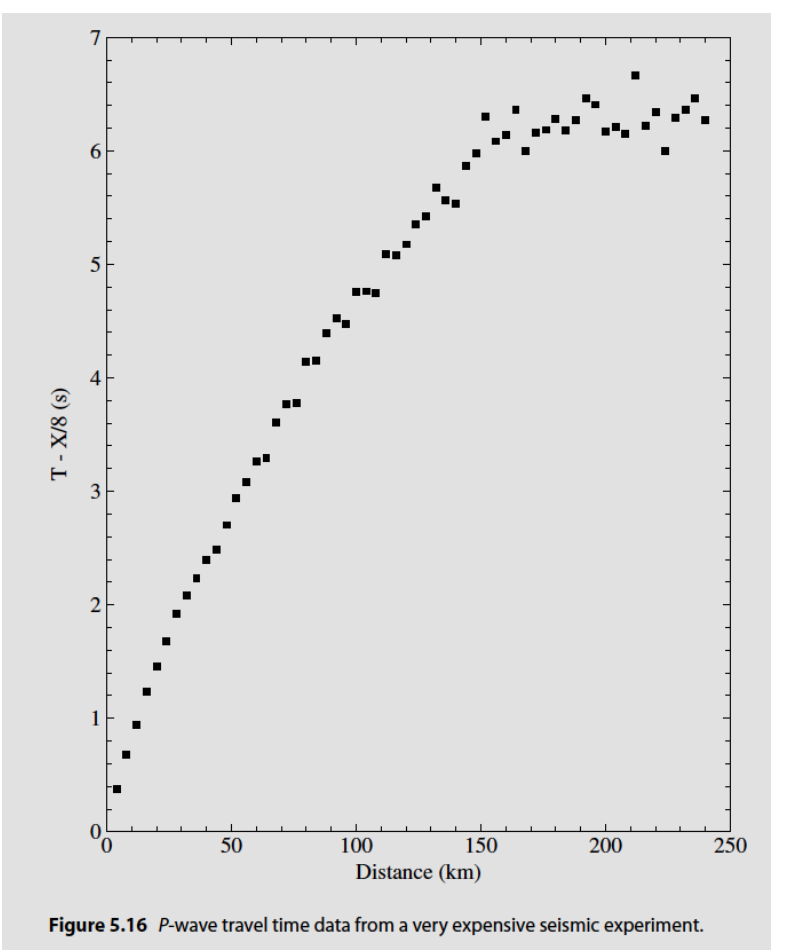
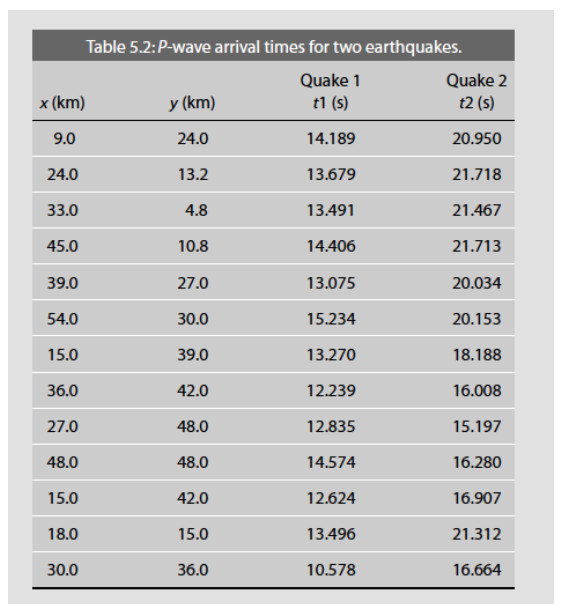
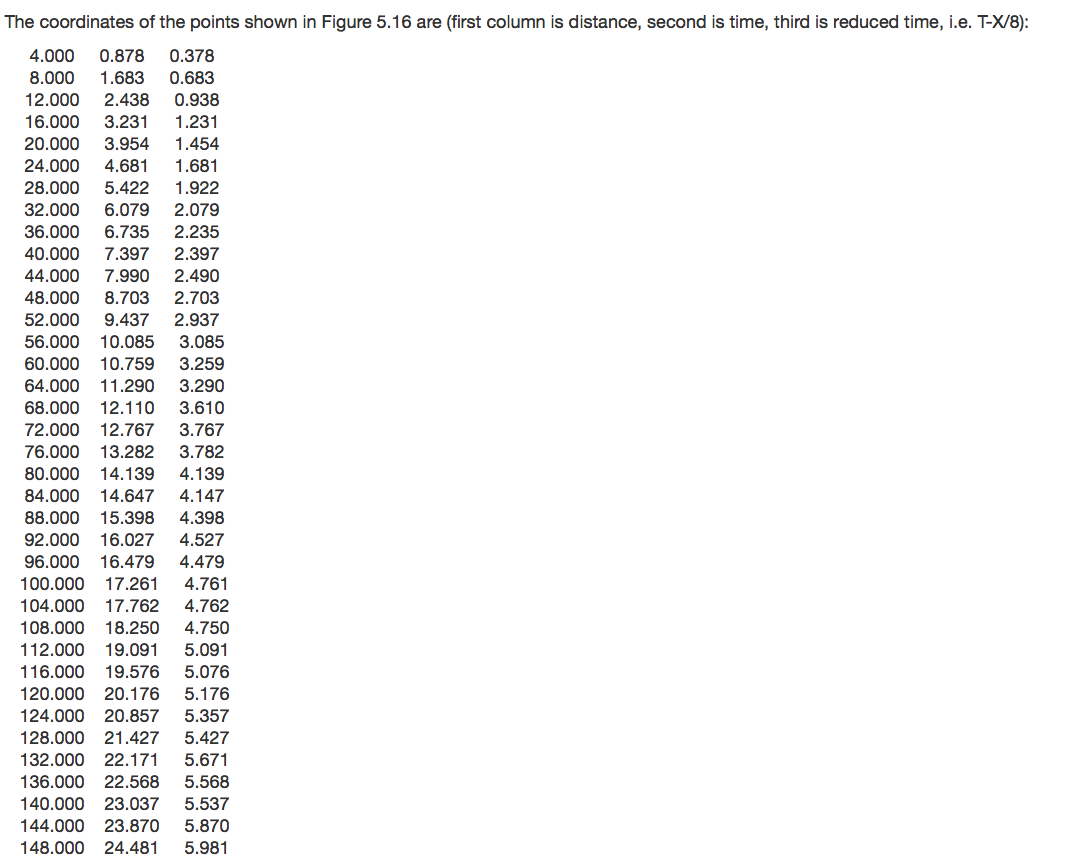
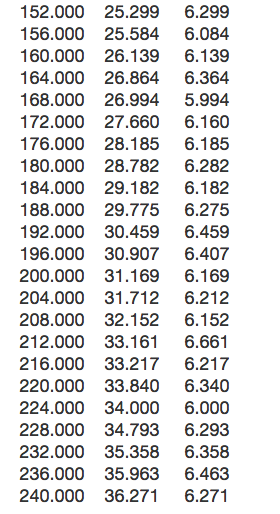
T-X/8 (s) 7 6 5 3 2 1 50 100 150 200 Distance (km) Figure 5.16 P-wave travel time data from a very expensive seismic experiment. 250 x (km) 9.0 24.0 33.0 45.0 39.0 54.0 15.0 36.0 27.0 48.0 15.0 18.0 30.0 Table 5.2: P-wave arrival times for two earthquakes. Quake 1 t1 (s) 14.189 13.679 13.491 14.406 y (km) 24.0 13.2 4.8 10.8 27.0 30.0 39.0 42.0 48.0 48.0 42.0 15.0 36.0 13.075 15.234 13.270 12.239 12.835 14.574 12.624 13.496 10.578 Quake 2 t2 (s) 20.950 21.718 21.467 21.713 20.034 20.153 18.188 16.008 15.197 16.280 16.907 21.312 16.664 The coordinates of the points shown in Figure 5.16 are (first column is distance, second is time, third is reduced time, i.e. T-X/8): 4.000 0.878 0.378 8.000 1.683 0.683 12.000 2.438 0.938 16.000 3.231 1.231 20.000 3.954 1.454 24.000 4.681 1.681 1.922 28.000 5.422 32.000 6.079 2.079 36.000 6.735 2.235 40.000 7.397 2.397 44.000 7.990 2.490 48.000 8.703 2.703 52.000 9.437 2.937 56.000 10.085 3.085 60.000 10.759 3.259 64.000 11.290 3.290 68.000 12.110 3.610 72.000 12.767 3.767 76.000 13.282 3.782 80.000 14.139 4.139 84.000 14.647 4.147 88.000 15.398 4.398 92.000 16.027 4.527 96.000 16.479 4.479 100.000 17.261 4.761 104.000 17.762 4.762 108.000 18.250 4.750 112.000 19.091 5.091 116.000 19.576 5.076 120.000 20.176 5.176 124.000 20.857 5.357 128.000 21.427 5.427 132.000 22.171 5.671 136.000 22.568 5.568 140.000 23.037 5.537 144.000 23.870 5.870 148.000 24.481 5.981 152.000 25.299 6.299 156.000 25.584 6.084 160.000 26.139 6.139 164.000 26.864 6.364 168.000 26.994 5.994 172.000 27.660 6.160 176.000 28.185 6.185 180.000 28.782 6.282 184.000 29.182 6.182 188.000 29.775 6.275 192.000 30.459 6.459 196.000 30.907 6.407 200.000 31.169 6.169 204.000 31.712 6.212 208.000 32.152 6.152 212.000 33.161 6.661 216.000 33.217 6.217 220.000 33.840 6.340 224.000 34.000 6.000 228.000 34.793 6.293 232.000 35.358 6.358 236.000 35.963 6.463 240.000 36.271 6.271
Step by Step Solution
3.38 Rating (145 Votes )
There are 3 Steps involved in it
Solution Steps Step 1 Fit Straight Lines to Data 1 Plot the Data Use the provided data points to create a plot of distance versus reduced time TX8 2 L... View full answer

Get step-by-step solutions from verified subject matter experts