

Question: Prompt Using the Project Two Financial Formulas spreadsheet and the balance sheet, income statement, and cash flow statement from Mergent Online for your chosen company,
Prompt
Using the Project Two Financial Formulas spreadsheet and the balance sheet, income statement, and cash flow statement from Mergent Online for your chosen company, calculate the financial ratios for the most recent fiscal quarter. Then, compare those ratios with the same ratios for the same fiscal quarter from one year prior in Mergent Online, and analyze your results.
Specifically, you must address the following rubric criteria:
- Financial Calculations: Calculate accurate financial ratios to assess the businesss current financial health. Specifically, calculate the following ratios:
- Working capital
- Current ratio
- Debt ratio
- Earnings per share
- Price/earnings ratio
- Total asset turnover ratio
- Financial leverage
- Net profit margin
- Return on assets
- Return on equity
- Fiscal Quarter Comparison: Using Mergent Online, summarize the differences between the results from your financial calculations of the most recent fiscal quarter and the results of the same financial calculations of the same fiscal quarter from a year before for your chosen business.
- For example, if the most recent fiscal quarter available is the 3rd quarter in 2020, then you will compare those results to the same financial calculations from the 3rd quarter in 2019.
- Comparison Analysis: Explain what the results of your calculations and your comparison indicate about the businesss current financial health, providing examples to support your explanation. You might consider the following questions:
- Do the results indicate the business is financially healthy or financially unhealthy? Which results indicate this?
- What might be the cause(s) of the businesss financial success or failure?
- Is more information needed to determine the businesss financial health? If so, which pieces of information might still be needed?
- Short-Term Financing: Explain how potential short-term financing sources could help the business raise needed funds to improve its financial health. Base your response on the businesss current financial information.
-
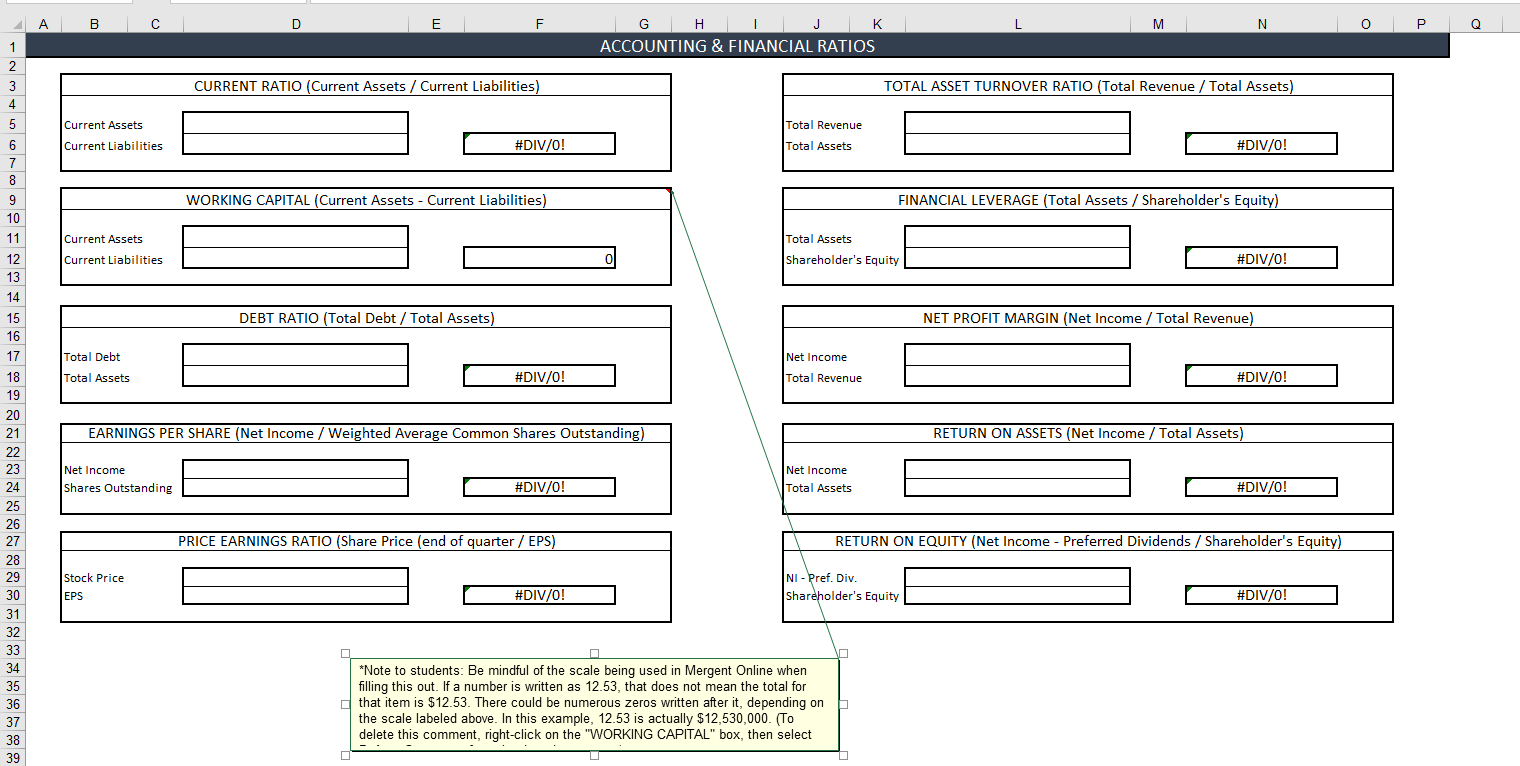
A B D E F M N 0 Q G H K ACCOUNTING & FINANCIAL RATIOS 1 2 3 4 CURRENT RATIO (Current Assets / Current Liabilities) TOTAL ASSET TURNOVER RATIO (Total Revenue / Total Assets) 5 Total Revenue Current Assets Current Liabilities #DIV/0! Total Assets #DIV/0! 6 7 8 WORKING CAPITAL (Current Assets - Current Liabilities) FINANCIAL LEVERAGE (Total Assets / Shareholder's Equity) 9 10 11 Current Assets Total Assets Shareholder's Equity Current Liabilities #DIV/0! 12 13 14 DEBT RATIO (Total Debt / Total Assets) NET PROFIT MARGIN (Net Income / Total Revenue) 15 16 17 Net Income Total Debt Total Assets #DIV/0! Total Revenue #DIV/0! EARNINGS PER SHARE (Net Income / Weighted Average Common Shares Outstanding) RETURN ON ASSETS (Net Income / Total Assets) Net Income Shares Outstanding Net Income Total Assets #DIV/0! #DIV/0! PRICE EARNINGS RATIO (Share Price (end of quarter / EPS) RETURN ON EQUITY (Net Income - Preferred Dividends / Shareholder's Equity) 18 19 20 21 22 23 24 25 26 27 28 29 30 31 32 33 34 35 36 37 38 39 Stock Price EPS NI - Pref. Div. Shareholder's Equity #DIV/0! #DIV/0! *Note to students: Be mindful of the scale being used in Mergent Online when filling this out. If a number is written as 12.53, that does not mean the total for that item is $12.53. There could be numerous zeros written after it, depending on the scale labeled above. In this example, 12.53 is actually $12,530,000. (To delete this comment, right-click on the "WORKING CAPITAL" box, then select A B D E F M N O P Rate of Return Initial Investment 1 2 9 11 Month Interest Investment Value $0 $ol SO Sol SO SO 10 $0 $ol SO SO 12 $0 $0 1 2 9 Month Interest Investment Value $0 sol SO $0 SO SOL 10 Sol sol 11 SO $0 12 $0 $0 1 2 9 Month Interest Investment Value $0 $ol SO Sol SO SO 10 $0 sol 11 SO SO 12 SO $0 1 2 9 Month Interest Investment Value 5 11 SO $0 sol SO $0 10 $0 sol SO SOL 12 $0 SO B 1 2 9 11 Month Interest Investment Value $0 $ol SO Sol G H K Time Value of Money - Monthly Compounding Year 1 3 4 5 6 7 8 SO SO SO SO SO SO SOL $0 $0 $0 SO $0 Year 2 3 4 5 6 7 8 SO SO SO SO SO SO SO $0 SO $0 SOL $0 Year 3 3 4 5 6 7 8 SO 0 $0 SO SO SO SO SON SO $0 SOL SO $0 Year 4 3 4 5 6 7 8 SO SO SO SO SO SO SO $0 SO $0 SOL $0 Year 5 3 4 5 6 7 8 SO 0 SO SO SO SO SO SO sol $0 $ol SO $0 Year 6 3 4 5 6 7 8 SO SO SO SO SO $0 SO $0 SOL $0 SOL $0 Year 7 3 4 5 6 7 8 $0 $0 $0 $0 $0 $0 SO SOL SOL SOL $0 SOL Year 8 3 4 5 6 7 8 $0 $0 $0 $0 $0 $0 SO SO SO SOL SO SO Year 9 3 4 5 6 7 8 $0 $0 $0 $0 $0 $0 SO $0 $0 SOL SO SOL Year 10 3 4 5 6 7 8 $0 SO $0 $o $0 $o SO SOL SO SO SO SO SO sol 10 $0 sol SO SO 12 SO $0 1 2 3 1 2 9 Month Interest Investment Value $0 Sol SO $0 SO SOL 10 $0 $0 11 $ SO 12 $0 $O1 5 2 9 3 Month Interest Investment Value 1 $0 $0 $0 $0 $0 SO 10 SO sol 11 $0 $0 12 SO $0 1 1 2 Month Interest Investment Value $0 $0 $0 Sol 9 $ol Sol 10 $0 Sol 11 $0 SO 12 $0 SO 3 1 1 2 9 Month Interest Investment Value $0 $0 $0 SO $0 SO 10 SO sol 11 SO SO 12 $0 SO 7 3 1 2 9 Month Interest Investment Value $0 Sol $0 Sol $0 $0 10 SO $0 11 SO SOL 12 SO SO 1 Net Present Value (NPV) Calculator Building 1 2 3 4 5 6 7 9 10 Year Cash Flows Year $0 $0 $0 $0 $0 1.9 $0 $0 NPV = $0 11 [2 14 15 3 7 Initial Investment 5 Annual Cash Inflows Discount Rate 7 Number of Years 3 Salvage Value 2 0 1 $0 16 $0 $0 17 $0 13 $0 19 $ 18 $0 20 Cash Flows $0 $0 $0 $0 $0 $0 Equipment 3 4 5 6 7 8 9 10 $0 $0 $0 $0 Year Cash Flows Year Cash Flows 1 $0 11 $0 2 $0 12 $0 NPV = $0 $0 13 $0 $0 14 $01 $0 15 $0 16 $0 20 17 $0 $0 19 $0 18 $0 $0 2 3 4 Initial Investment 5 Annual Cash Inflows 6 Discount Rate 7 Number of Years 8 Salvage Value 9 0 1 2 3 4 Initial Investment 5 Annual Cash Inflows 6 Discount Rate 7 Number of Years 8 Principal Returned 9 Bonds NPV = $0 1 3 4 6 7 8 9 10 Year Cash Flows 2 $0 5 $0 $0 $0 $0 $0 $0 $0 $0 $0 L M N 1 9 Rate of Return Initial Investment Year interest Investment Value K Time Value of Money - Annual Compounding 2 3 4 5 6 2 SO SO SO SO SO SO SO $0 SO sol SO SO SO $0 8 SO SO $0 SO 10 SO $ Time Value of Money - Present Value Annuity Number of Years Rate of Return $0.00 Payment Time Value of Money - Future Value Annuity Number of Years Rate of Return $0.00 Payment 1 Time Value of Money - Present Value of Lump Sum ? Rate 3 Years $0.00 1 Initial Investment E Time Value of Money - Future Value of Lump Sum Rate Years $0.00 Initial Investment A B D E F M N 0 Q G H K ACCOUNTING & FINANCIAL RATIOS 1 2 3 4 CURRENT RATIO (Current Assets / Current Liabilities) TOTAL ASSET TURNOVER RATIO (Total Revenue / Total Assets) 5 Total Revenue Current Assets Current Liabilities #DIV/0! Total Assets #DIV/0! 6 7 8 WORKING CAPITAL (Current Assets - Current Liabilities) FINANCIAL LEVERAGE (Total Assets / Shareholder's Equity) 9 10 11 Current Assets Total Assets Shareholder's Equity Current Liabilities #DIV/0! 12 13 14 DEBT RATIO (Total Debt / Total Assets) NET PROFIT MARGIN (Net Income / Total Revenue) 15 16 17 Net Income Total Debt Total Assets #DIV/0! Total Revenue #DIV/0! EARNINGS PER SHARE (Net Income / Weighted Average Common Shares Outstanding) RETURN ON ASSETS (Net Income / Total Assets) Net Income Shares Outstanding Net Income Total Assets #DIV/0! #DIV/0! PRICE EARNINGS RATIO (Share Price (end of quarter / EPS) RETURN ON EQUITY (Net Income - Preferred Dividends / Shareholder's Equity) 18 19 20 21 22 23 24 25 26 27 28 29 30 31 32 33 34 35 36 37 38 39 Stock Price EPS NI - Pref. Div. Shareholder's Equity #DIV/0! #DIV/0! *Note to students: Be mindful of the scale being used in Mergent Online when filling this out. If a number is written as 12.53, that does not mean the total for that item is $12.53. There could be numerous zeros written after it, depending on the scale labeled above. In this example, 12.53 is actually $12,530,000. (To delete this comment, right-click on the "WORKING CAPITAL" box, then select A B D E F M N O P Rate of Return Initial Investment 1 2 9 11 Month Interest Investment Value $0 $ol SO Sol SO SO 10 $0 $ol SO SO 12 $0 $0 1 2 9 Month Interest Investment Value $0 sol SO $0 SO SOL 10 Sol sol 11 SO $0 12 $0 $0 1 2 9 Month Interest Investment Value $0 $ol SO Sol SO SO 10 $0 sol 11 SO SO 12 SO $0 1 2 9 Month Interest Investment Value 5 11 SO $0 sol SO $0 10 $0 sol SO SOL 12 $0 SO B 1 2 9 11 Month Interest Investment Value $0 $ol SO Sol G H K Time Value of Money - Monthly Compounding Year 1 3 4 5 6 7 8 SO SO SO SO SO SO SOL $0 $0 $0 SO $0 Year 2 3 4 5 6 7 8 SO SO SO SO SO SO SO $0 SO $0 SOL $0 Year 3 3 4 5 6 7 8 SO 0 $0 SO SO SO SO SON SO $0 SOL SO $0 Year 4 3 4 5 6 7 8 SO SO SO SO SO SO SO $0 SO $0 SOL $0 Year 5 3 4 5 6 7 8 SO 0 SO SO SO SO SO SO sol $0 $ol SO $0 Year 6 3 4 5 6 7 8 SO SO SO SO SO $0 SO $0 SOL $0 SOL $0 Year 7 3 4 5 6 7 8 $0 $0 $0 $0 $0 $0 SO SOL SOL SOL $0 SOL Year 8 3 4 5 6 7 8 $0 $0 $0 $0 $0 $0 SO SO SO SOL SO SO Year 9 3 4 5 6 7 8 $0 $0 $0 $0 $0 $0 SO $0 $0 SOL SO SOL Year 10 3 4 5 6 7 8 $0 SO $0 $o $0 $o SO SOL SO SO SO SO SO sol 10 $0 sol SO SO 12 SO $0 1 2 3 1 2 9 Month Interest Investment Value $0 Sol SO $0 SO SOL 10 $0 $0 11 $ SO 12 $0 $O1 5 2 9 3 Month Interest Investment Value 1 $0 $0 $0 $0 $0 SO 10 SO sol 11 $0 $0 12 SO $0 1 1 2 Month Interest Investment Value $0 $0 $0 Sol 9 $ol Sol 10 $0 Sol 11 $0 SO 12 $0 SO 3 1 1 2 9 Month Interest Investment Value $0 $0 $0 SO $0 SO 10 SO sol 11 SO SO 12 $0 SO 7 3 1 2 9 Month Interest Investment Value $0 Sol $0 Sol $0 $0 10 SO $0 11 SO SOL 12 SO SO 1 Net Present Value (NPV) Calculator Building 1 2 3 4 5 6 7 9 10 Year Cash Flows Year $0 $0 $0 $0 $0 1.9 $0 $0 NPV = $0 11 [2 14 15 3 7 Initial Investment 5 Annual Cash Inflows Discount Rate 7 Number of Years 3 Salvage Value 2 0 1 $0 16 $0 $0 17 $0 13 $0 19 $ 18 $0 20 Cash Flows $0 $0 $0 $0 $0 $0 Equipment 3 4 5 6 7 8 9 10 $0 $0 $0 $0 Year Cash Flows Year Cash Flows 1 $0 11 $0 2 $0 12 $0 NPV = $0 $0 13 $0 $0 14 $01 $0 15 $0 16 $0 20 17 $0 $0 19 $0 18 $0 $0 2 3 4 Initial Investment 5 Annual Cash Inflows 6 Discount Rate 7 Number of Years 8 Salvage Value 9 0 1 2 3 4 Initial Investment 5 Annual Cash Inflows 6 Discount Rate 7 Number of Years 8 Principal Returned 9 Bonds NPV = $0 1 3 4 6 7 8 9 10 Year Cash Flows 2 $0 5 $0 $0 $0 $0 $0 $0 $0 $0 $0 L M N 1 9 Rate of Return Initial Investment Year interest Investment Value K Time Value of Money - Annual Compounding 2 3 4 5 6 2 SO SO SO SO SO SO SO $0 SO sol SO SO SO $0 8 SO SO $0 SO 10 SO $ Time Value of Money - Present Value Annuity Number of Years Rate of Return $0.00 Payment Time Value of Money - Future Value Annuity Number of Years Rate of Return $0.00 Payment 1 Time Value of Money - Present Value of Lump Sum ? Rate 3 Years $0.00 1 Initial Investment E Time Value of Money - Future Value of Lump Sum Rate Years $0.00 Initial Investment
Step by Step Solution
There are 3 Steps involved in it

Get step-by-step solutions from verified subject matter experts