

Question: Provide step by step guide on how to solve these financial problems including which formulas to use and why? I am trying to learn which
Provide step by step guide on how to solve these financial problems including which formulas to use and why? I am trying to learn which formulas to use in these examples and am confused on what process I should use. Can you please assist and also provide a link where I can download the excel spreadsheet?
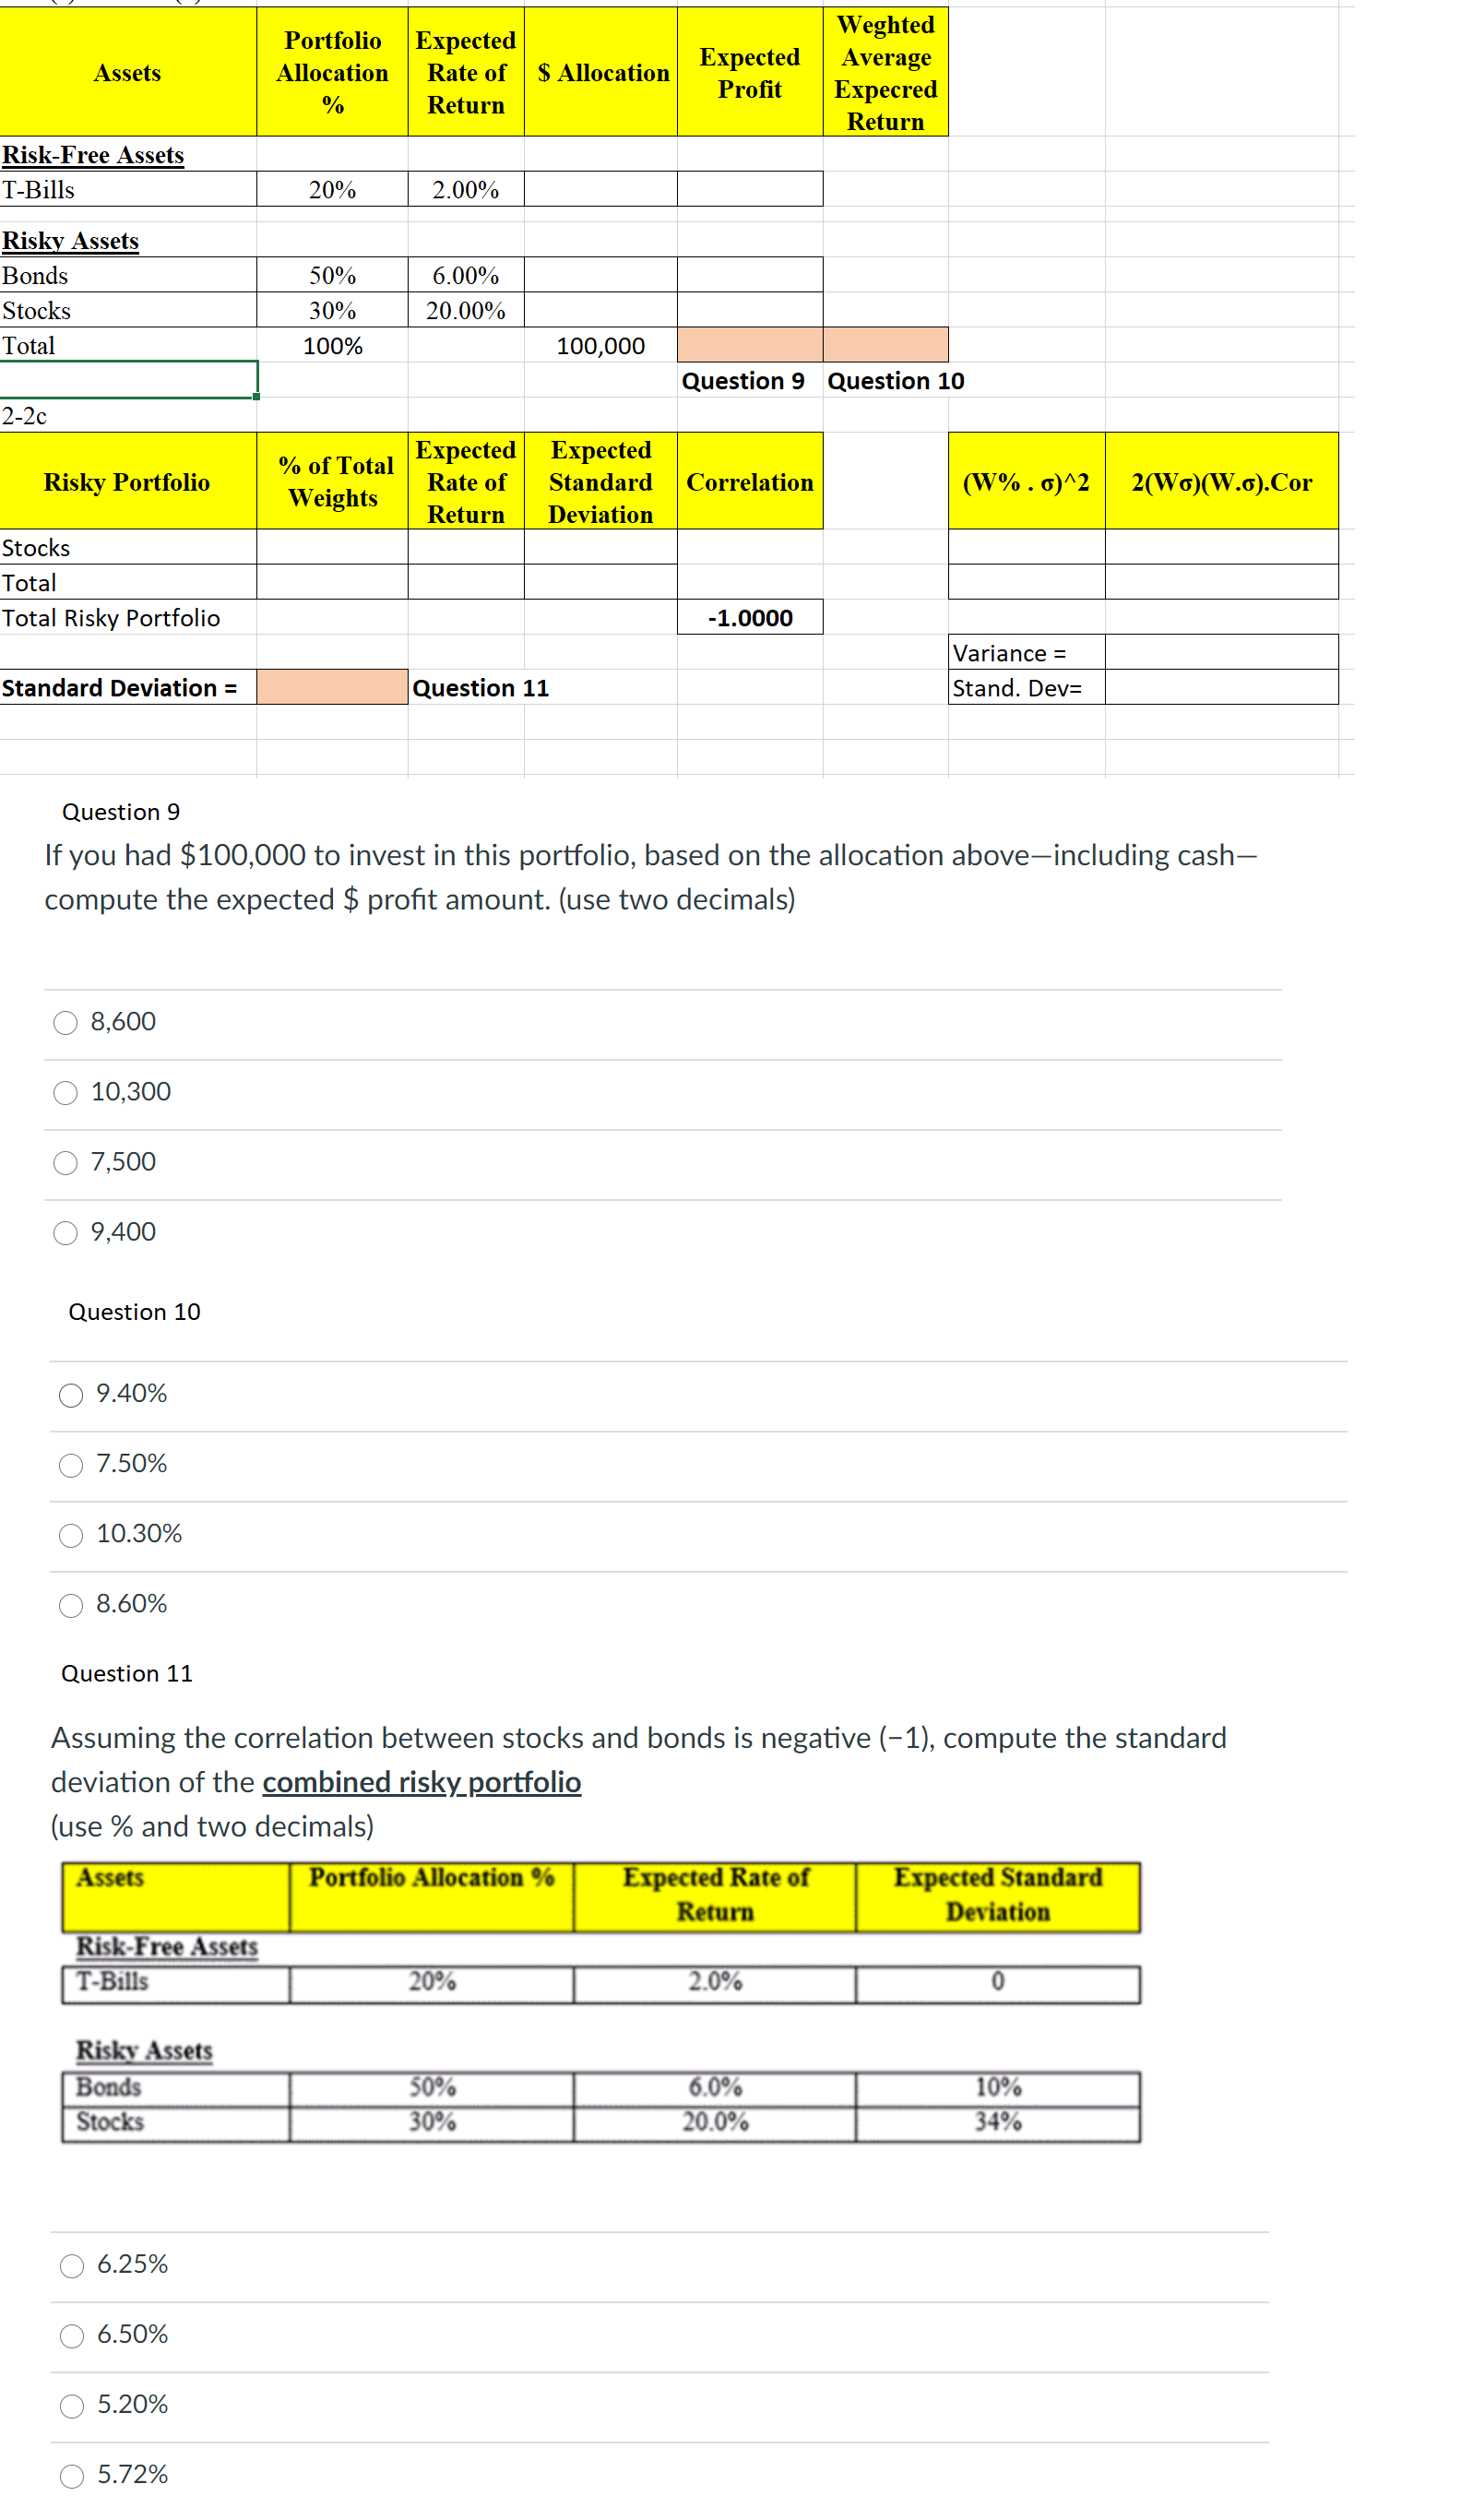
how to calculate the (W% . ?)^2 2(W?)(W.?).Cor? entries? an please show the formulas used
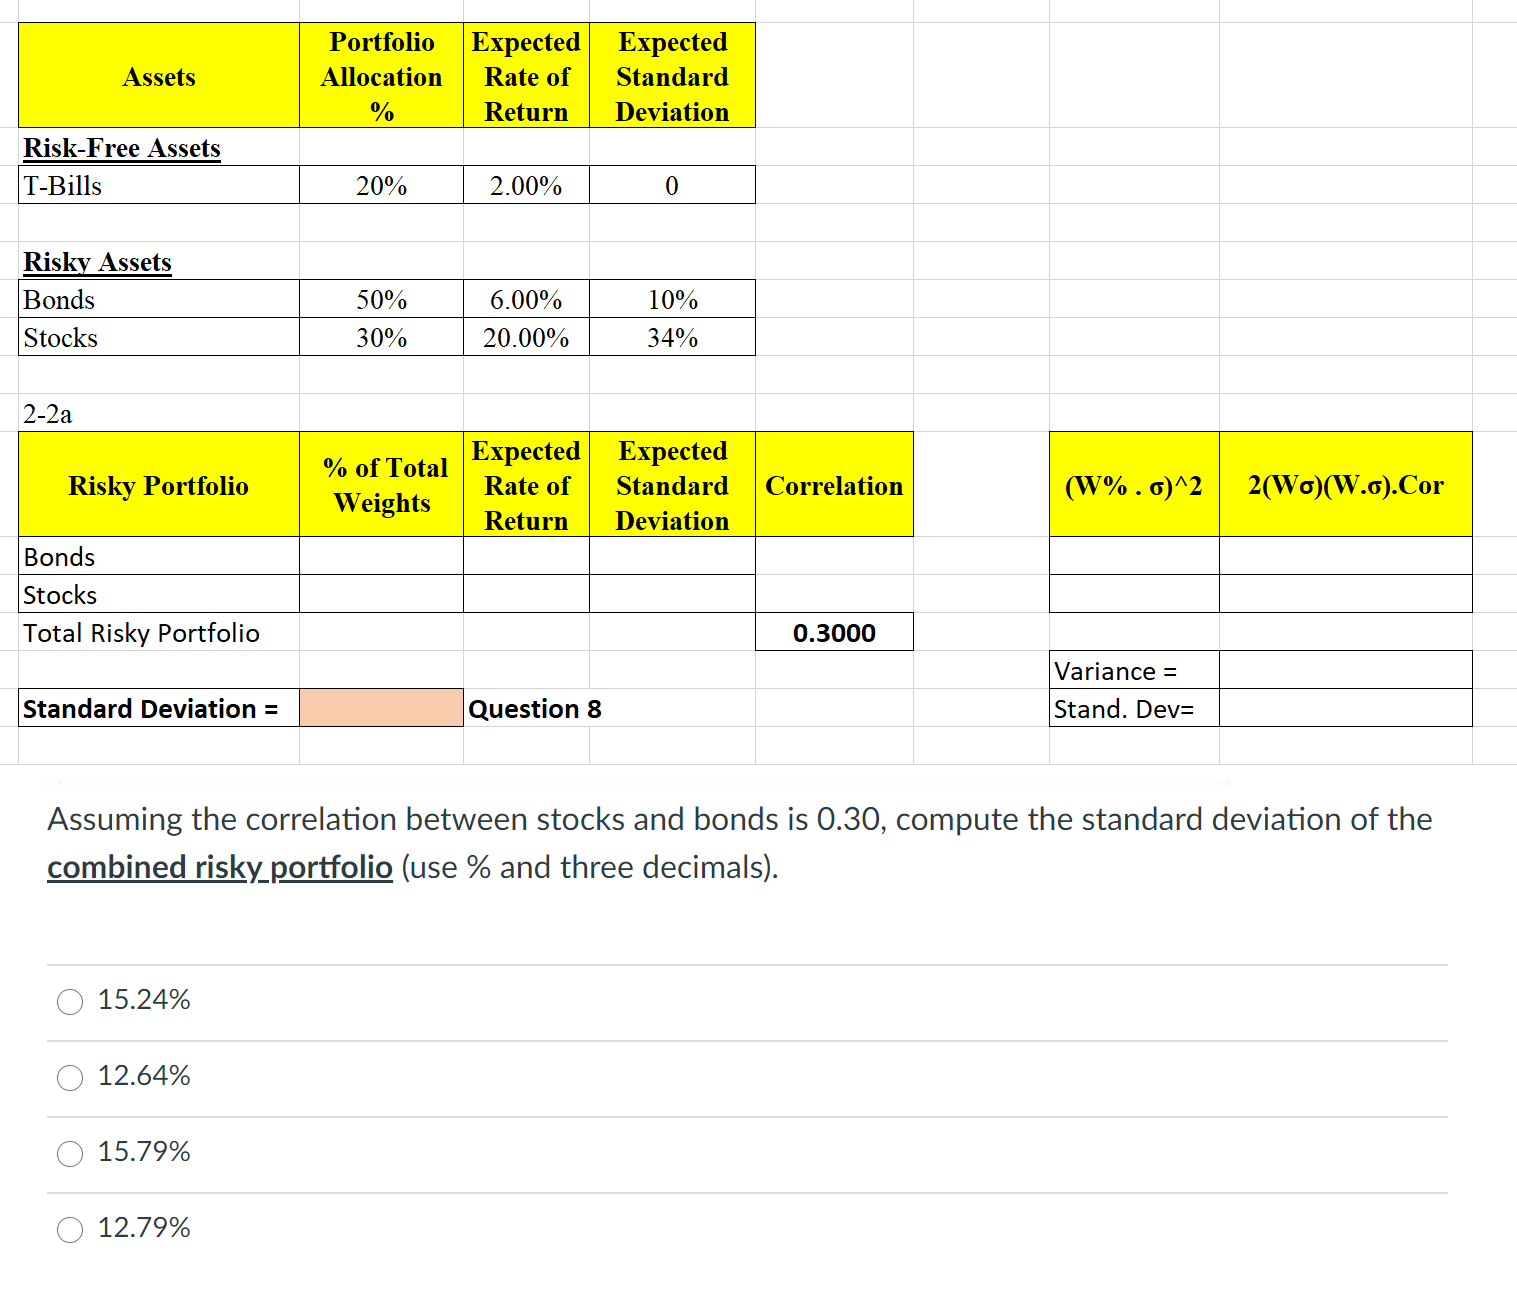
Assets Risk-Free Assets T-Bills Risky Assets Bonds Stocks 2-2a Risky Portfolio Bonds Stocks Total Risky Portfolio Standard Deviation = 15.24% 12.64% 15.79% 12.79% Portfolio Expected Allocation Rate of % 20% 50% 30% Expected Standard Return Deviation % of Total Weights 2.00% 6.00% 20.00% Expected Rate of Return Question 8 0 10% 34% Expected Standard Deviation Correlation Assuming the correlation between stocks and bonds is 0.30, compute the standard deviation of the combined risky portfolio (use % and three decimals). 0.3000 (W%. 6)^2 2(Wo)(W.o).Cor Variance = Stand. Dev=
Step by Step Solution
3.26 Rating (155 Votes )
There are 3 Steps involved in it
To calculate the standard deviation of the combined risky portfolio we can use the formula for portf... View full answer

Get step-by-step solutions from verified subject matter experts