

Question: python 3 Plot a formula Make a plot of the function y(t) = Vot-58t for vo = 10, g = 9.81, and t E [0,
python 3
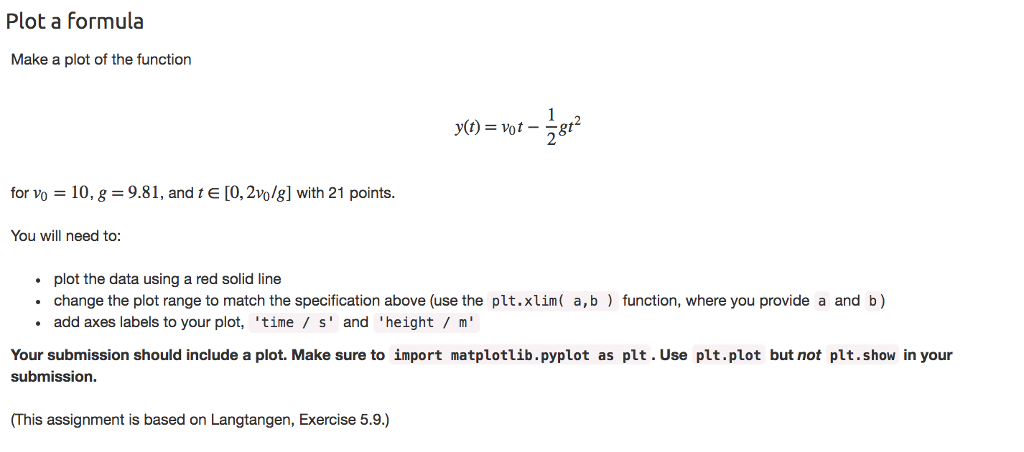
Plot a formula Make a plot of the function y(t) = Vot-58t for vo = 10, g = 9.81, and t E [0, 2m/g] with 21 points. You will need to: plot the data using a red solid line change the plot range to match the specification above (use the plt.xlim( a,b add axes labels to your plot, 'time / s' and 'height/m' function, where you provide a and b) Your submission should include a plot. Make sure to import matplotlib. pyplot as plt.Use plt.plot but not plt.show in your submission. This assignment is based on Langtangen, Exercise 5.9.)
Step by Step Solution
There are 3 Steps involved in it
1 Expert Approved Answer
Step: 1 Unlock

Question Has Been Solved by an Expert!
Get step-by-step solutions from verified subject matter experts
Step: 2 Unlock
Step: 3 Unlock