

Question: Python 3.7 please help 5 Exercise 5: Plot the following functions into a single graph BUT use a subplot for each function. So your figure
Python 3.7 please help 5 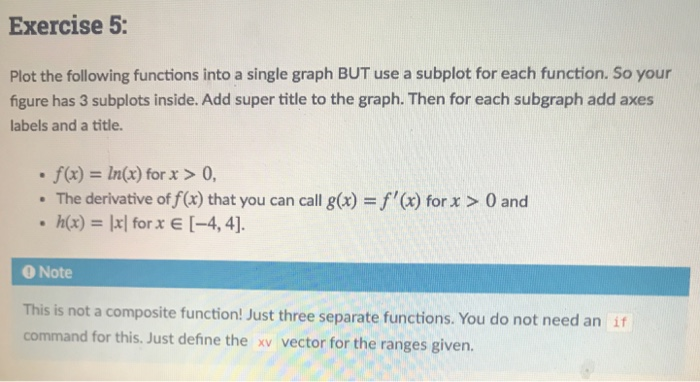
Exercise 5: Plot the following functions into a single graph BUT use a subplot for each function. So your figure has 3 subplots inside. Add super title to the graph. Then for each subgraph add axes labels and a title. . f(x) = ln(x) for x > 0, The derivative of f(x) that you can call g(x) = f'(x) for x > 0 and h(x) = |x|for x (-4, 4]. Note This is not a composite function! Just three separate functions. You do not need an if command for this. Just define the xv vector for the ranges given
Step by Step Solution
There are 3 Steps involved in it
1 Expert Approved Answer
Step: 1 Unlock

Question Has Been Solved by an Expert!
Get step-by-step solutions from verified subject matter experts
Step: 2 Unlock
Step: 3 Unlock