

Question: Q 2 . The figure below represents a schematic of pipe network. A rate of Q L s - 1 , is pumped to feed
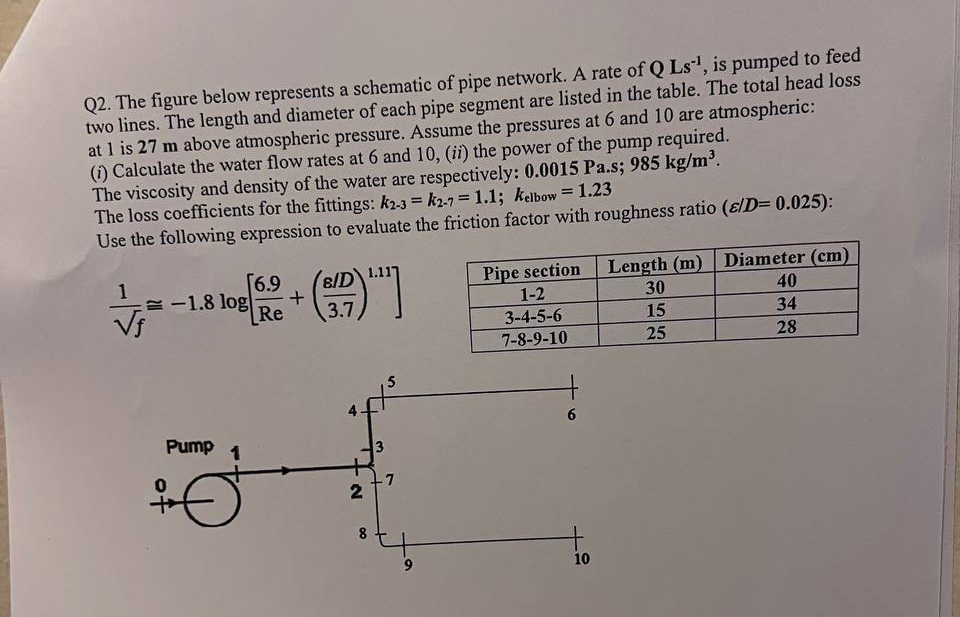
Q The figure below represents a schematic of pipe network. A rate of is pumped to feed two lines. The length and diameter of each pipe segment are listed in the table. The total head loss at is m above atmospheric pressure. Assume the pressures at and are atmospheric:
i Calculate the water flow rates at and ii the power of the pump required.
The viscosity and density of the water are respectively: Pas;
The loss coefficients for the fittings: ;
Use the following expression to evaluate the friction factor with roughness ratio :
~
tablePipe section,Length mDiameter cm
Step by Step Solution
There are 3 Steps involved in it
1 Expert Approved Answer
Step: 1 Unlock

Question Has Been Solved by an Expert!
Get step-by-step solutions from verified subject matter experts
Step: 2 Unlock
Step: 3 Unlock