

Question: Q: Identify summarizability problems in your star schema and indicate preferred resolutions of the summarizability problems. For incomplete dimension-fact relationships, you should also indicate if
Q: Identify summarizability problems in your star schema and indicate preferred resolutions of the summarizability problems. For incomplete dimension-fact relationships, you should also indicate if columns in a dimension table allow null values.
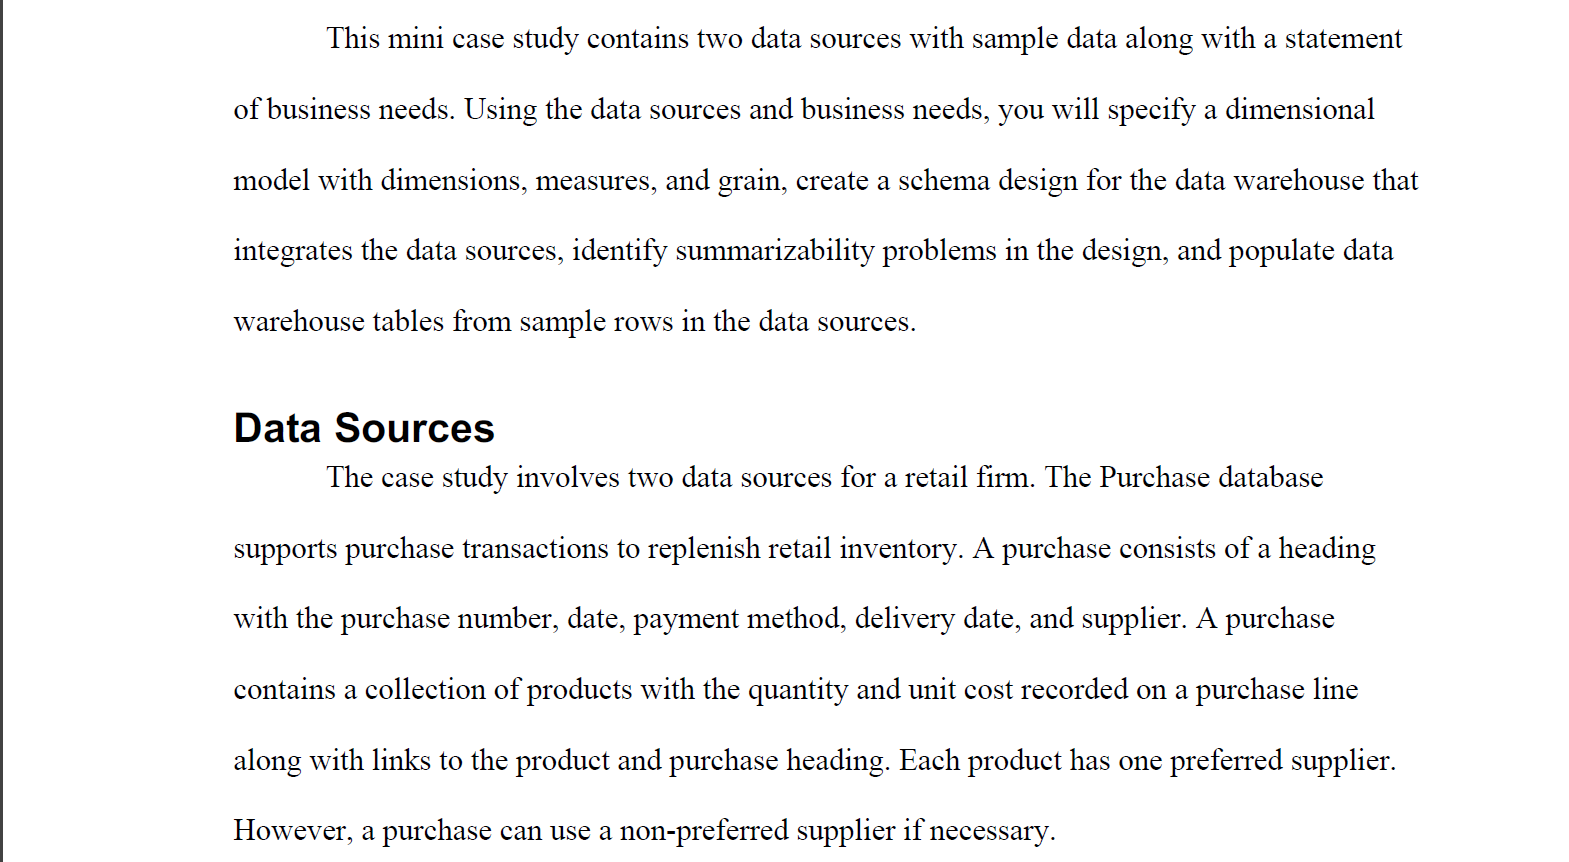
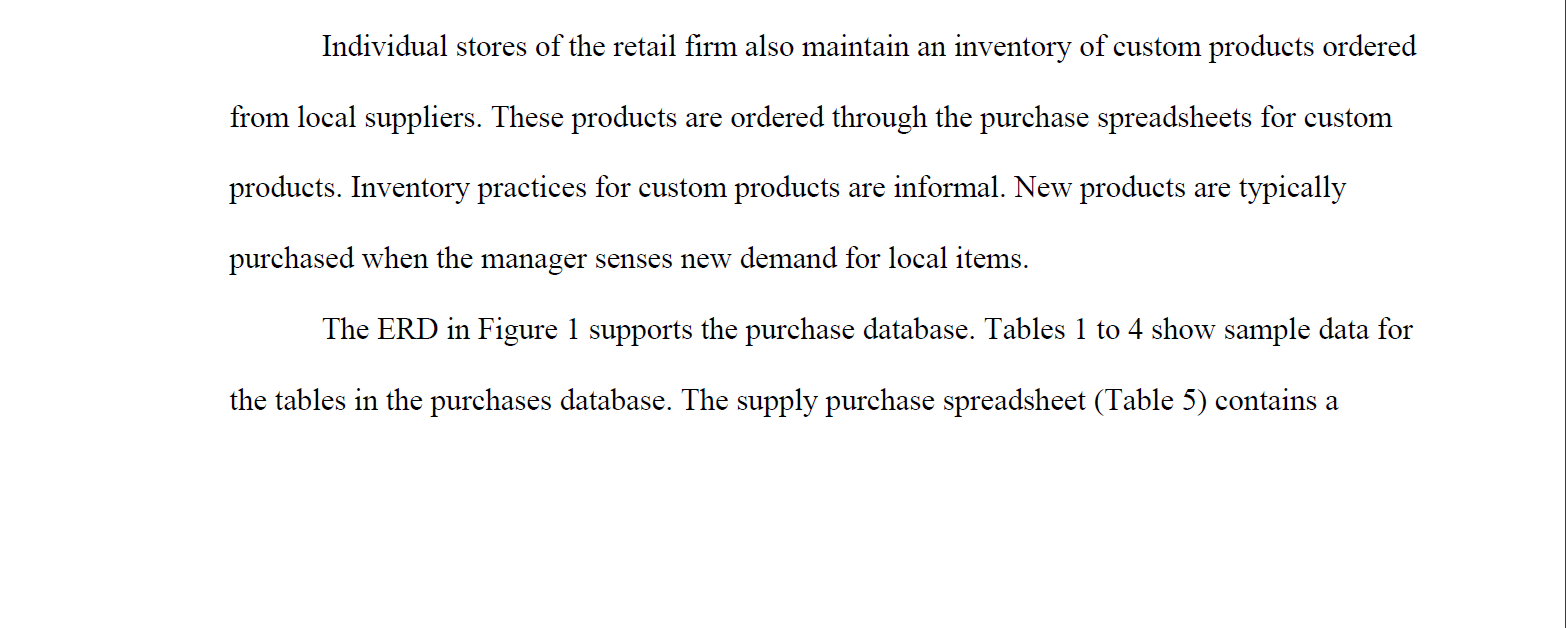
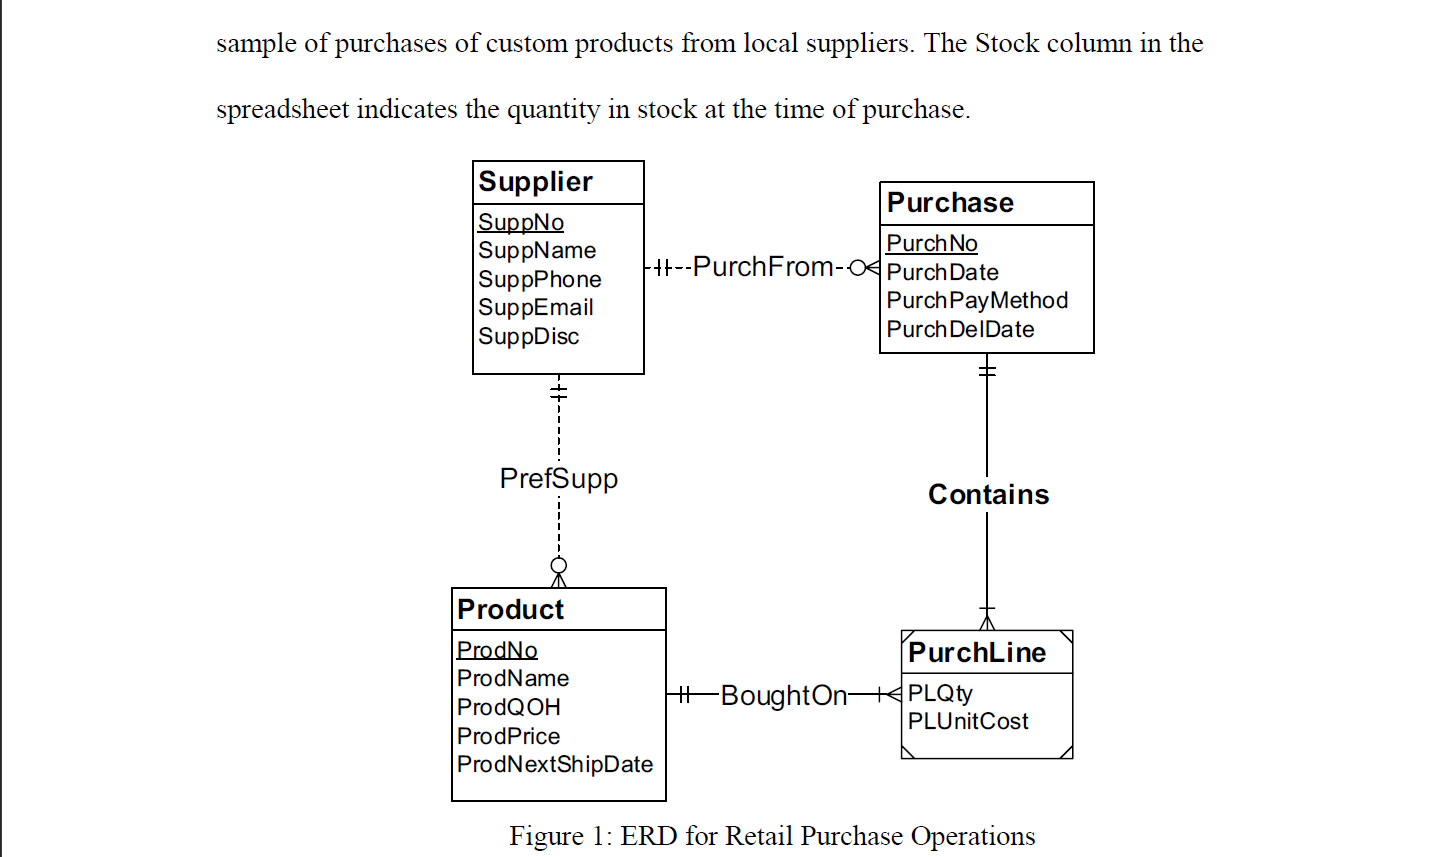
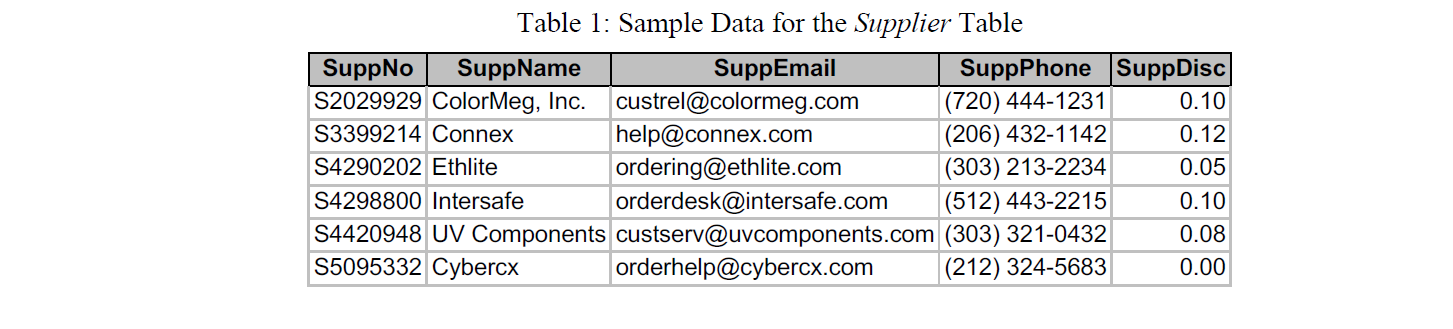
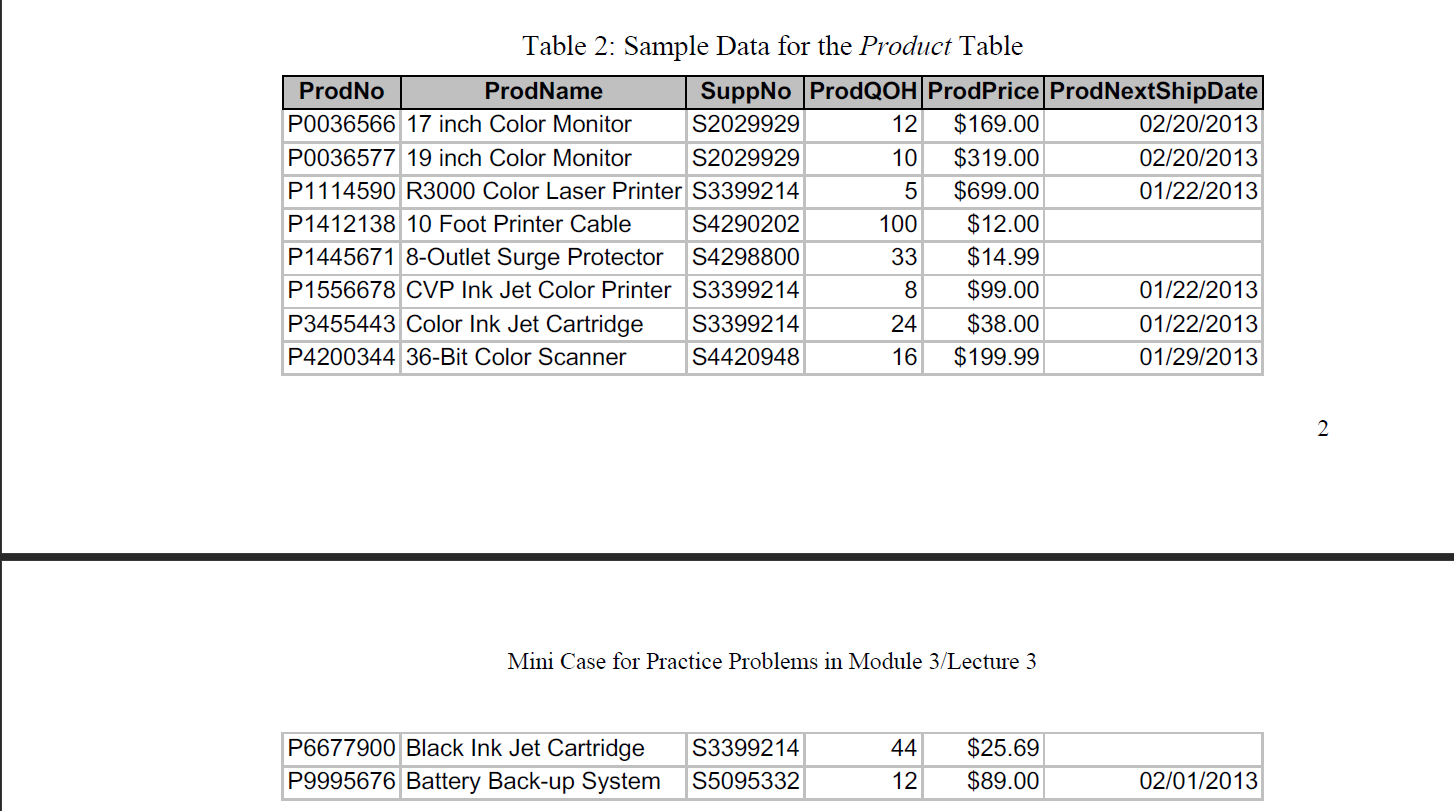
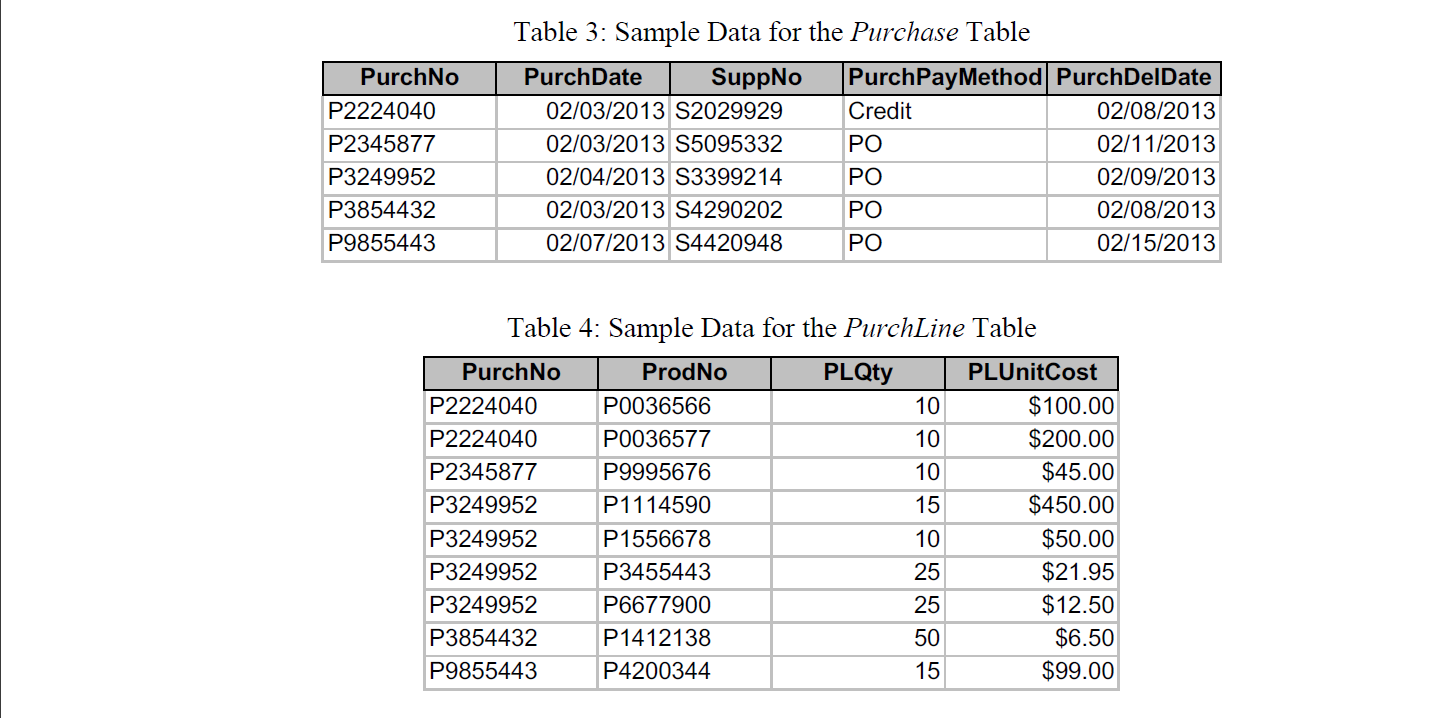

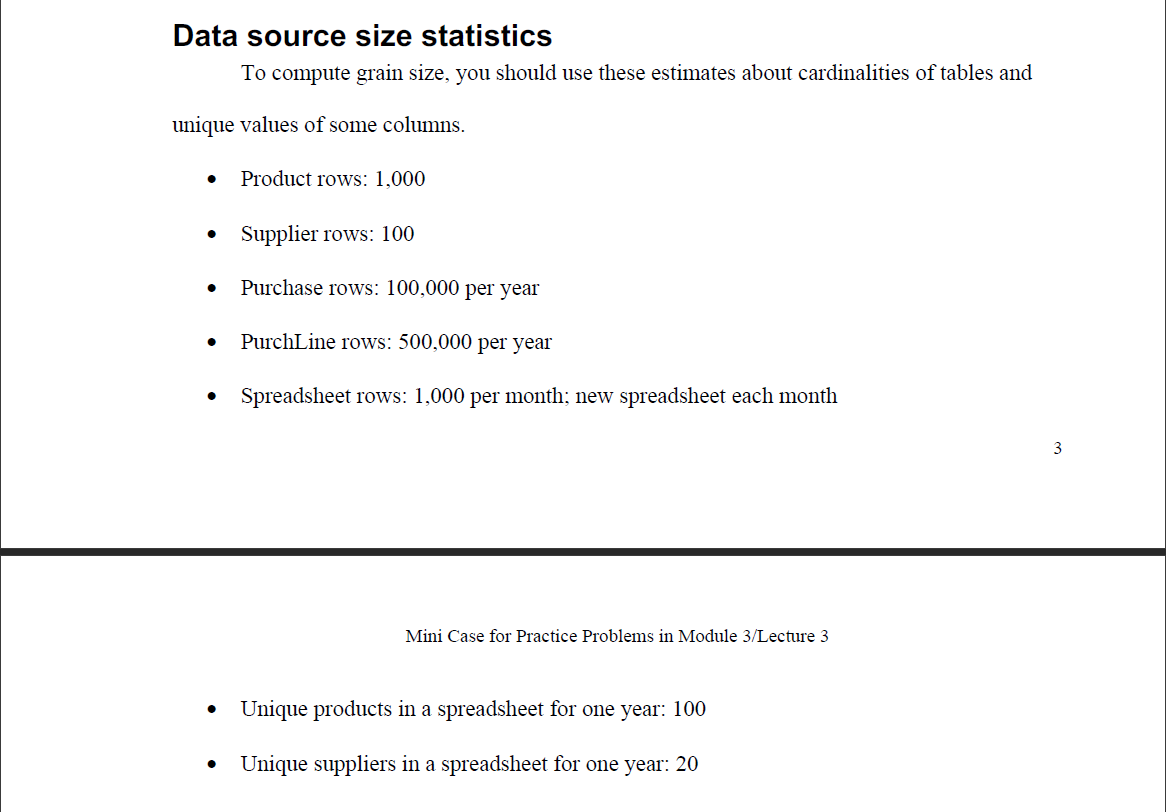
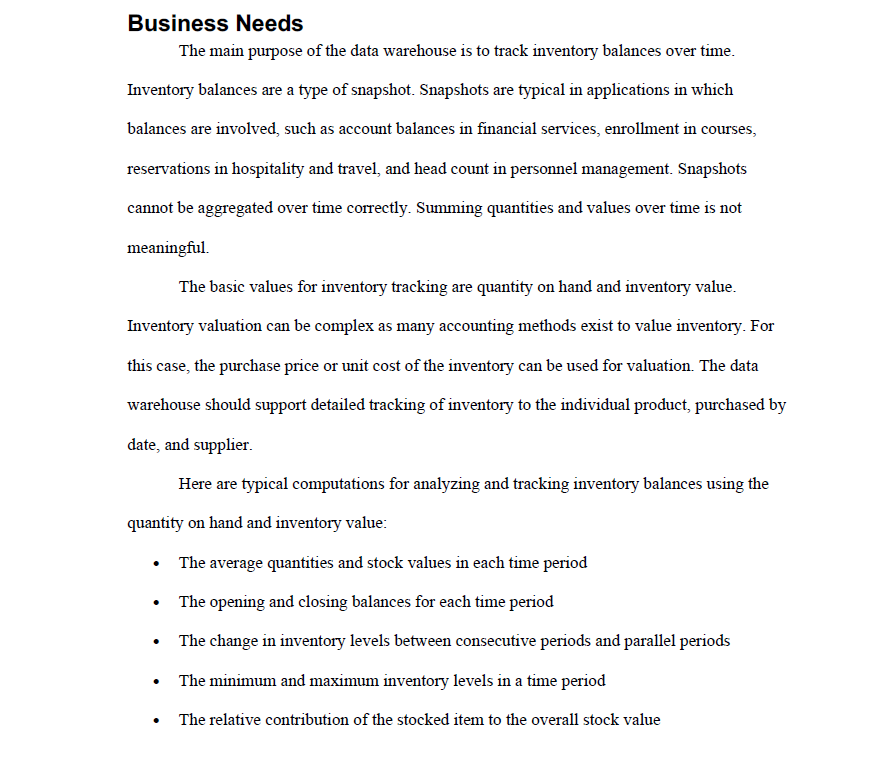
This mini case study contains two data sources with sample data along with a statement of business needs. Using the data sources and business needs, you will specify a dimensional model with dimensions, measures, and grain, create a schema design for the data warehouse that integrates the data sources, identify summarizability problems in the design, and populate data warehouse tables from sample rows in the data sources. Data Sources The case study involves two data sources for a retail firm. The Purchase database supports purchase transactions to replenish retail inventory. A purchase consists of a heading with the purchase number, date, payment method, delivery date, and supplier. A purchase contains a collection of products with the quantity and unit cost recorded on a purchase line along with links to the product and purchase heading. Each product has one preferred supplier. However, a purchase can use a non-preferred supplier if necessary. Individual stores of the retail firm also maintain an inventory of custom products ordered from local suppliers. These products are ordered through the purchase spreadsheets for custom products. Inventory practices for custom products are informal. New products are typically purchased when the manager senses new demand for local items. The ERD in Figure 1 supports the purchase database. Tables 1 to 4 show sample data for the tables in the purchases database. The supply purchase spreadsheet (Table 5) contains a sample of purchases of custom products from local suppliers. The Stock column in the spreadsheet indicates the quantity in stock at the time of purchase. Figure 1: ERD for Retail Purchase Operations Table 1: Sample Data for the Supplier Table Table 2: Sample Data for the Product Table Mini Case for Practice Problems in Module 3/ Lecture 3 Table 3: Sample Data for the Purchase Table Table 4: Sample Data for the PurchLine Table Table 5: Sample Spreadsheet Data for Custom Product Purchases Data source size statistics To compute grain size, you should use these estimates about cardinalities of tables and unique values of some columns. - Product rows: 1,000 - Supplier rows: 100 - Purchase rows: 100,000 per year - PurchLine rows: 500,000 per year - Spreadsheet rows: 1,000 per month; new spreadsheet each month Business Needs The main purpose of the data warehouse is to track inventory balances over time. Inventory balances are a type of snapshot. Snapshots are typical in applications in which balances are involved, such as account balances in financial services, enrollment in courses, reservations in hospitality and travel, and head count in personnel management. Snapshots cannot be aggregated over time correctly. Summing quantities and values over time is not meaningful. The basic values for inventory tracking are quantity on hand and inventory value. Inventory valuation can be complex as many accounting methods exist to value inventory. For this case, the purchase price or unit cost of the inventory can be used for valuation. The data warehouse should support detailed tracking of inventory to the individual product, purchased by date, and supplier. Here are typical computations for analyzing and tracking inventory balances using the quantity on hand and inventory value: - The average quantities and stock values in each time period - The opening and closing balances for each time period - The change in inventory levels between consecutive periods and parallel periods - The minimum and maximum inventory levels in a time period - The relative contribution of the stocked item to the overall stock value This mini case study contains two data sources with sample data along with a statement of business needs. Using the data sources and business needs, you will specify a dimensional model with dimensions, measures, and grain, create a schema design for the data warehouse that integrates the data sources, identify summarizability problems in the design, and populate data warehouse tables from sample rows in the data sources. Data Sources The case study involves two data sources for a retail firm. The Purchase database supports purchase transactions to replenish retail inventory. A purchase consists of a heading with the purchase number, date, payment method, delivery date, and supplier. A purchase contains a collection of products with the quantity and unit cost recorded on a purchase line along with links to the product and purchase heading. Each product has one preferred supplier. However, a purchase can use a non-preferred supplier if necessary. Individual stores of the retail firm also maintain an inventory of custom products ordered from local suppliers. These products are ordered through the purchase spreadsheets for custom products. Inventory practices for custom products are informal. New products are typically purchased when the manager senses new demand for local items. The ERD in Figure 1 supports the purchase database. Tables 1 to 4 show sample data for the tables in the purchases database. The supply purchase spreadsheet (Table 5) contains a sample of purchases of custom products from local suppliers. The Stock column in the spreadsheet indicates the quantity in stock at the time of purchase. Figure 1: ERD for Retail Purchase Operations Table 1: Sample Data for the Supplier Table Table 2: Sample Data for the Product Table Mini Case for Practice Problems in Module 3/ Lecture 3 Table 3: Sample Data for the Purchase Table Table 4: Sample Data for the PurchLine Table Table 5: Sample Spreadsheet Data for Custom Product Purchases Data source size statistics To compute grain size, you should use these estimates about cardinalities of tables and unique values of some columns. - Product rows: 1,000 - Supplier rows: 100 - Purchase rows: 100,000 per year - PurchLine rows: 500,000 per year - Spreadsheet rows: 1,000 per month; new spreadsheet each month Business Needs The main purpose of the data warehouse is to track inventory balances over time. Inventory balances are a type of snapshot. Snapshots are typical in applications in which balances are involved, such as account balances in financial services, enrollment in courses, reservations in hospitality and travel, and head count in personnel management. Snapshots cannot be aggregated over time correctly. Summing quantities and values over time is not meaningful. The basic values for inventory tracking are quantity on hand and inventory value. Inventory valuation can be complex as many accounting methods exist to value inventory. For this case, the purchase price or unit cost of the inventory can be used for valuation. The data warehouse should support detailed tracking of inventory to the individual product, purchased by date, and supplier. Here are typical computations for analyzing and tracking inventory balances using the quantity on hand and inventory value: - The average quantities and stock values in each time period - The opening and closing balances for each time period - The change in inventory levels between consecutive periods and parallel periods - The minimum and maximum inventory levels in a time period - The relative contribution of the stocked item to the overall stock value
Step by Step Solution
There are 3 Steps involved in it

Get step-by-step solutions from verified subject matter experts