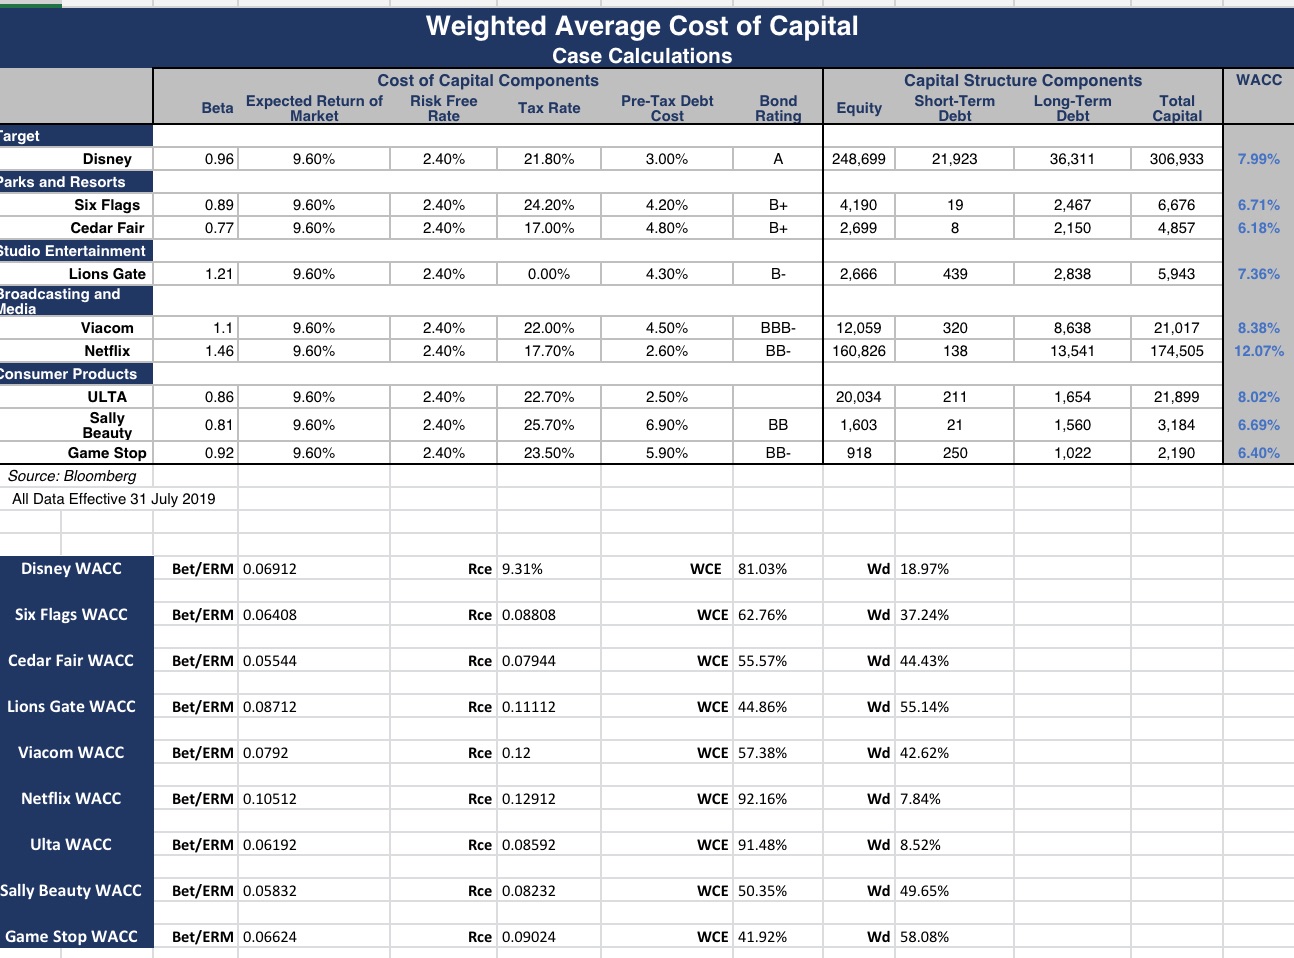
Question: Q1. Describe the primary WACC drivers that explain the differences between the WACC of Disney and its comparables. Weighted Average Cost of Capital Case Calculations
Q1. Describe the primary WACC drivers that explain the differences between the WACC of Disney and its comparables.
Weighted Average Cost of Capital Case Calculations Cost of Capital Components Capital Structure Components WACC Beta Expected Return of Risk Free Pre-Tax Debt Bond Long-Term Total Market Rate Tax Rate Short-Term Cost Rating Equity Debt Debt Capital arget Disney 0.96 9.60% 2.40% 21.80% 3.00% A 248,699 21,923 36,311 306,933 7.99% arks and Resorts Six Flags 0.89 9.60% 2.40% 24.20% 4.20% B+ 4,190 19 2,467 6,676 6.71% Cedar Fair 0.77 9.60% 2.40% 17.00% 4.80% B+ 2,699 8 2,150 4,857 6.18% studio Entertainment Lions Gate 1.21 9.60% 2.40% 0.00% 4.30% B- 2,666 439 2,838 5,943 7.36% Broadcasting and ledia Viacom 1.1 9.60% 2.40% 22.00% 4.50% BBB- 12,059 320 8,638 21,017 8.38% Netflix 1.46 9.60% 2.40% 17.70% 2.60% BB- 160,826 138 13,541 174,505 12.07% Consumer Products ULTA 0.86 9.60% 2.40% 22.70% 2.50% 20,034 211 1,654 21,899 8.02% Sally 0.81 9.60% 2.40% 25.70% 6.90% BB 1,603 21 1,560 3,184 6.69% Beauty Game Stop 0.92 9.60% 2.40% 23.50% 5.90% BB- 918 250 1,022 2,190 6.40% Source: Bloomberg All Data Effective 31 July 2019 Disney WACC Bet/ERM 0.06912 Rce 9.31% WCE 81.03% Wd 18.97% Six Flags WACC Bet/ERM 0.06408 Rce 0.08808 WCE 62.76% Wd 37.24% Cedar Fair WACC Bet/ERM 0.05544 Rce 0.07944 WCE 55.57% Wd 44.43% Lions Gate WACC Bet/ERM 0.08712 Rce 0.11112 WCE 44. Wd 55.14% Viacom WACC Bet/ERM 0.0792 Rce 0.12 WCE 57.38% Wd 42.62% Netflix WACC Bet/ERM 0.10512 Rce 0.12912 WCE 92.16% Wd 7.84% Ulta WACC Bet/ERM 0.06192 Rce 0.08592 WCE 91.48% Wd 8.52% Sally Beauty WACC Bet/ERM 0.05832 Rce 0.08232 WCE 50.35% Wd 49.65% Game Stop WACC Bet/ERM 0.06624 Rce 0.09024 WCE 41.92% Wd 58.08%