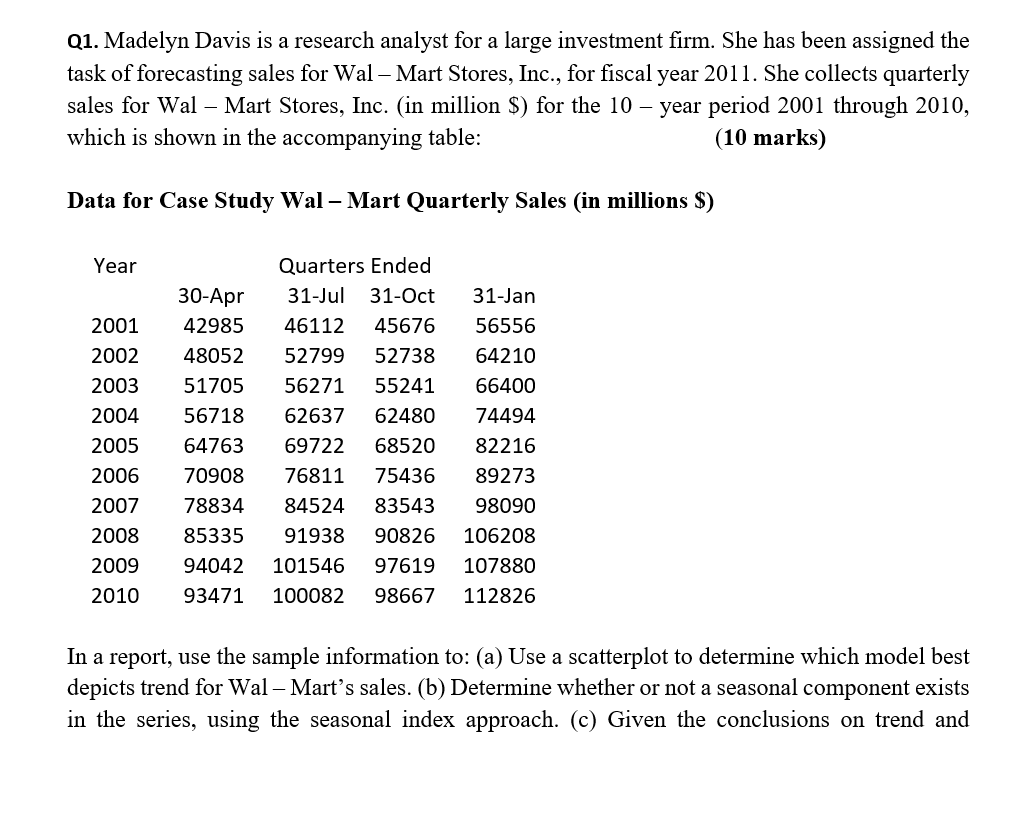
Question: Q1. Madelyn Davis is a research analyst for a large investment firm. She has been assigned the task of forecasting sales for Wal Mart Stores,

Q1. Madelyn Davis is a research analyst for a

Q1. Madelyn Davis is a research analyst for a large investment firm. She has been assigned the task of forecasting sales for Wal Mart Stores, Inc., for fiscal year 2011. She collects quarterly sales for Wal Mart Stores, Inc. (in million $) for the 10 year period 2001 through 2010, which is shown in the accompanying table: (10 marks) Data for Case Study Wal Mart Quarterly Sales (in millions $) Year 2001 2002 2003 2004 2005 2006 2007 2008 2009 2010 30-Apr 42985 48052 51705 56718 64763 70908 78834 85335 94042 93471 Quarters Ended 31-Jul 31-Oct 46112 45676 52799 52738 56271 55241 62637 62480 69722 68520 76811 75436 84524 83543 91938 90826 101546 97619 100082 98667 31-Jan 56556 64210 66400 74494 82216 89273 98090 106208 107880 112826 In a report, use the sample information to: (a) Use a scatterplot to determine which model best depicts trend for Wal Mart's sales. (b) Determine whether or not a seasonal component exists in the series, using the seasonal index approach. (c) Given the conclusions on trend and

Step by Step Solution

There are 3 Steps involved in it

1 Expert Approved Answer
Step: 1 Unlock blur-text-image
Question Has Been Solved by an Expert!

Get step-by-step solutions from verified subject matter experts

Step: 2 Unlock
Step: 3 Unlock

Students Have Also Explored These Related General Management Questions!