Question: Q17 Using the same data on Covid-19 test collected in the previous question, a statistical process control chart was used for this purpose as shown

Q17 Q17 Using the same data on Covid-19 test
Using the same data on Covid-19 test collected in the previous question, a statistical process control chart was used for this purpose as shown here. What is the UCL, LCL and the mean in the control chart? 0.16 0.14 0.12 0.1 Proportion Defective 0.08 W 0.06 0.04 0.02 0 0 1 2 3 4 5 6 7 8 9 10 11 12 13 14 15 16 Sample Number UCL 16, LCLO, Mean 8 UCL 0.115. LCL 0.057. Mean 0.085 UCL 0.2. LCL 0.14, Mean 0.0 UCL 0.14. LCL 0.02. Mean 0.085 UCL 0.16, LCL O. Mean 0.0

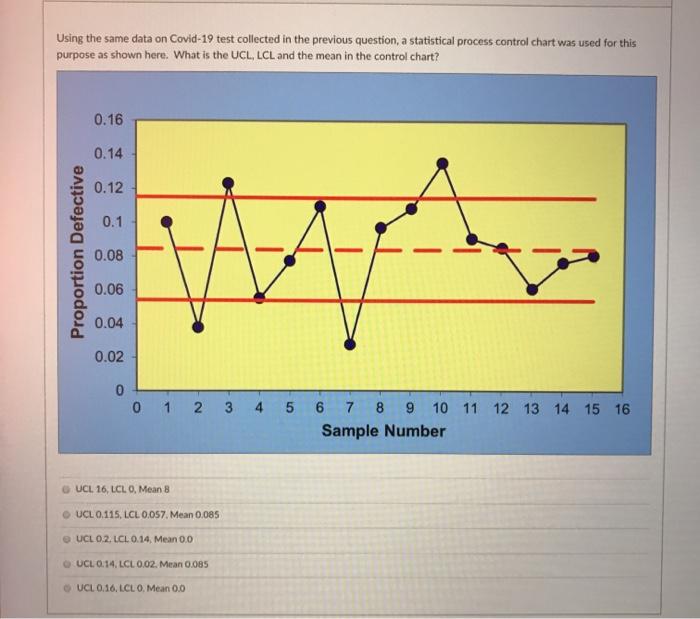
Step by Step Solution

There are 3 Steps involved in it

1 Expert Approved Answer
Step: 1 Unlock blur-text-image
Question Has Been Solved by an Expert!

Get step-by-step solutions from verified subject matter experts

Step: 2 Unlock
Step: 3 Unlock

Students Have Also Explored These Related General Management Questions!