

Question: Q3 -Performance capability indices A quality engineer collected process data. The process average, process standard deviation, upper specification limits (USL), and lower specification limit (LSL)
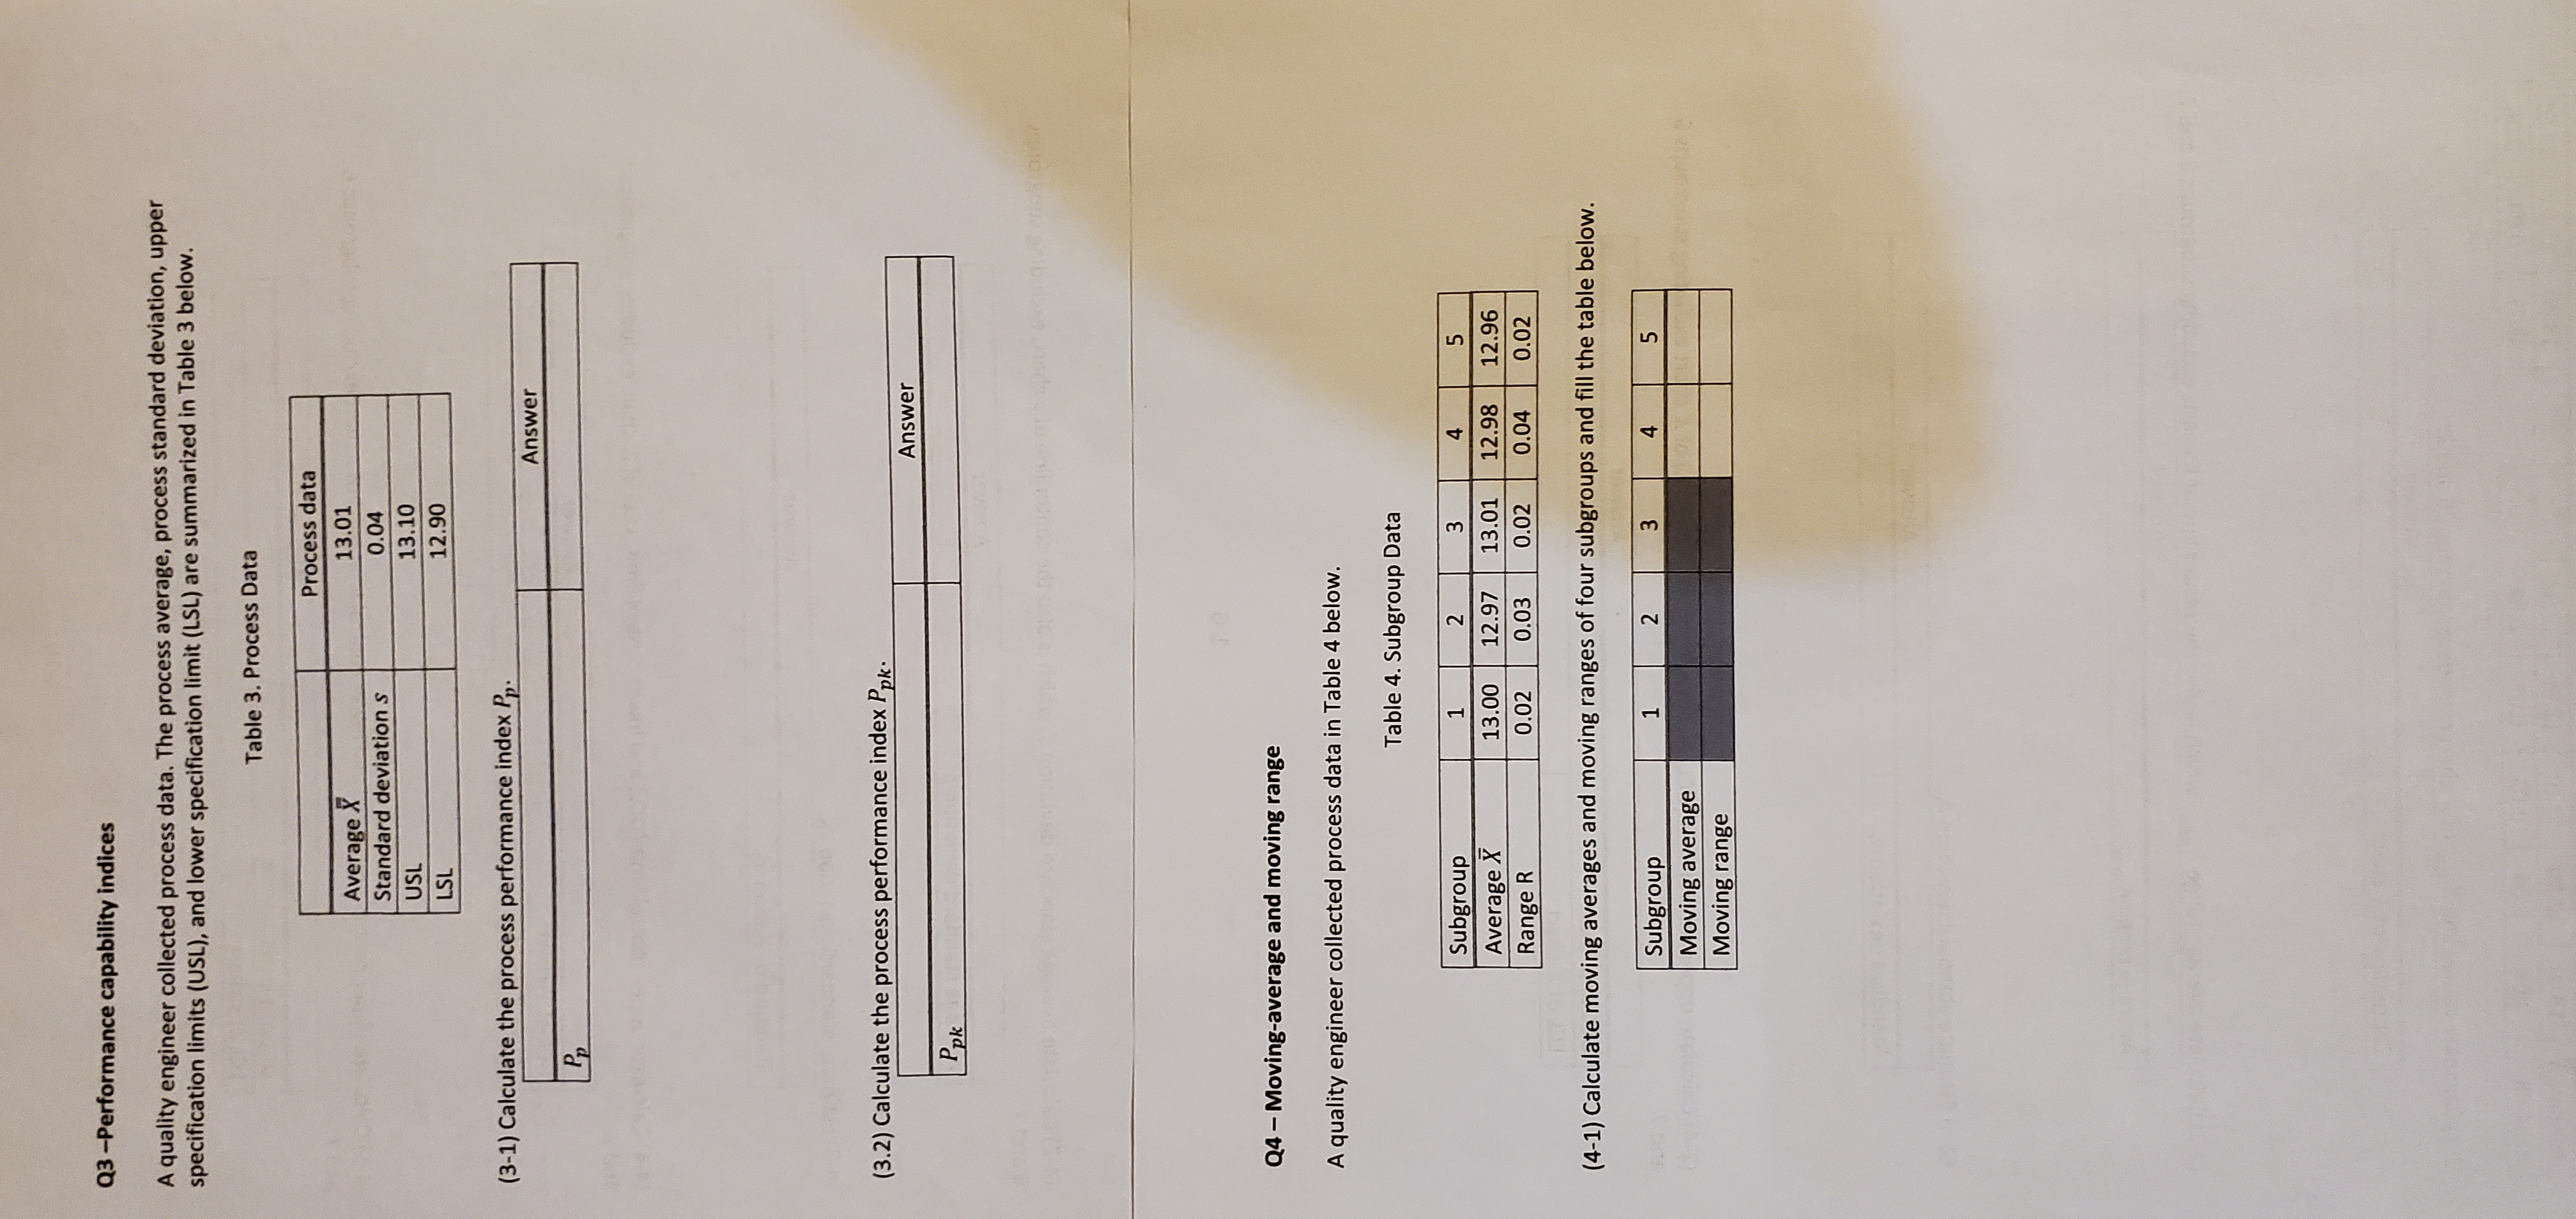
Q3 -Performance capability indices A quality engineer collected process data. The process average, process standard deviation, upper specification limits (USL), and lower specification limit (LSL) are summarized in Table 3 below. Table 3. Process Data Process data Average X 13.01 Standard deviation S 0.04 USL 13.10 LSL 12.90 (3-1) Calculate the process performance index Pp Answer Pp (3.2) Calculate the process performance index Ppk. Answer Ppk Q4 - Moving-average and moving range A quality engineer collected process data in Table 4 below. Table 4. Subgroup Data Subgroup 1 2 3 4 5 Average X 13.00 12.97 13.01 12.98 12.96 Range R 0.02 0.03 0.02 0.04 0.02 (4-1) Calculate moving averages and moving ranges of four subgroups and fill the table below. Subgroup 1 2 3 4 5 Moving average Moving range
Step by Step Solution
There are 3 Steps involved in it

Get step-by-step solutions from verified subject matter experts