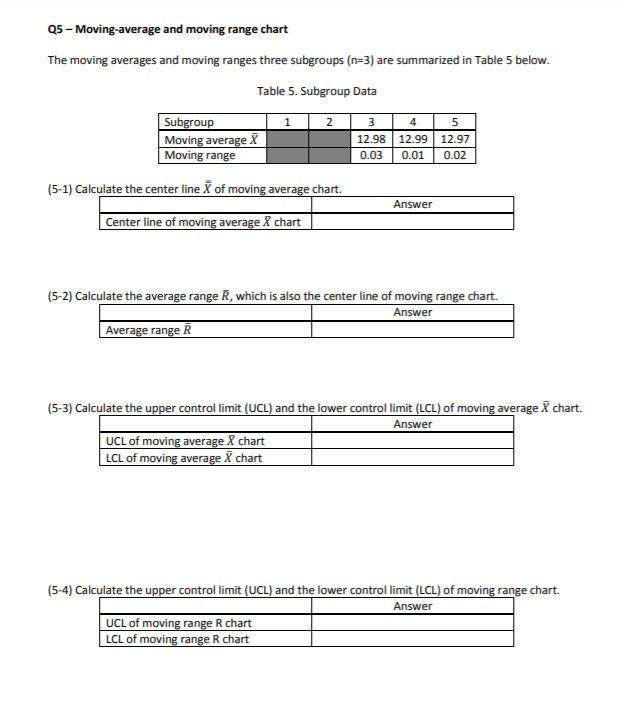
Question: Q5 - Moving average and moving range chart The moving averages and moving ranges three subgroups (n=3) are summarized in Table 5 below. Table 5.

Q5 - Moving average and moving range chart The

Q5 - Moving average and moving range chart The moving averages and moving ranges three subgroups (n=3) are summarized in Table 5 below. Table 5. Subgroup Data 1 2 Subgroup Moving average X Moving range (5-1) Calculate the center line X of moving average chart. 3 4 5 12.98 12.99 12.97 0.03 0.01 0.02 Answer Center line of moving average X chart (5-2) Calculate the average range R, which is also the center line of moving range chart. Answer Average range R (5-3) Calculate the upper controllimit (UCL) and the lower controllimit (LCL) of moving average X chart. Answer UCL of moving average & chart LCL of moving average X chart (5-4) Calculate the upper control limit (UCL) and the lower controllimit (LCL) of moving range chart. Answer UCL of moving range R chart LCL of moving range R chart

Step by Step Solution

There are 3 Steps involved in it

1 Expert Approved Answer
Step: 1 Unlock blur-text-image
Question Has Been Solved by an Expert!

Get step-by-step solutions from verified subject matter experts

Step: 2 Unlock
Step: 3 Unlock

Students Have Also Explored These Related General Management Questions!