

Question: quality engineering Multiple Choice (1 point each) The control limits for a U chart are drawn based on which of the following distribution? (A) Binomial
quality engineering 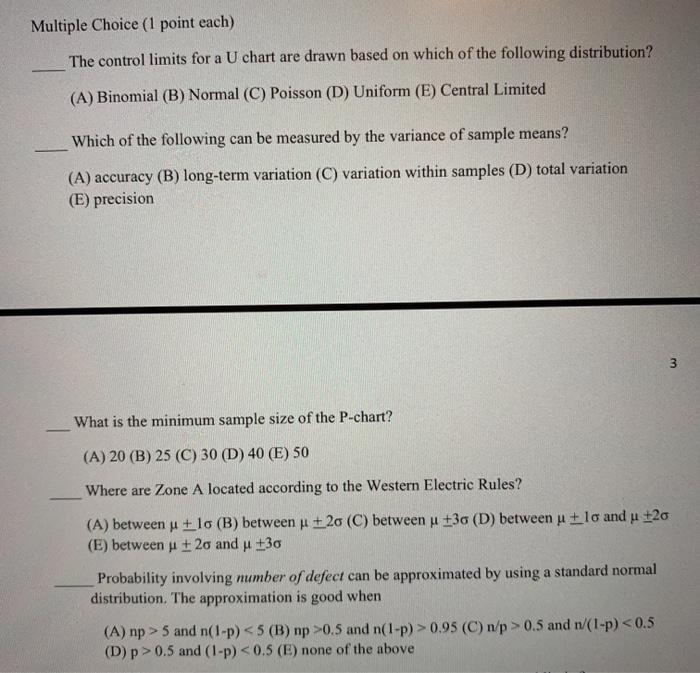
Multiple Choice (1 point each) The control limits for a U chart are drawn based on which of the following distribution? (A) Binomial (B) Normal (C) Poisson (D) Uniform (E) Central Limited Which of the following can be measured by the variance of sample means? (A) accuracy (B) long-term variation (C) variation within samples (D) total variation (E) precision What is the minimum sample size of the P-chart? (A) 20 (B) 25 (C) 30 (D) 40 (E) 50 Where are Zone A located according to the Western Electric Rules? (A) between y + 10 (B) between p +20 (C) between u +30 (D) between ulo and u +20 (E) between u + 20 and u +30 Probability involving number of defect can be approximated by using a standard normal distribution. The approximation is good when (A) np > 5 and n(1-p) 0.5 and n(1-p) >0.95 (C) n/p > 0.5 and 1/(1-p) 0.5 and (1-p) Step by Step Solution
There are 3 Steps involved in it
1 Expert Approved Answer
Step: 1 Unlock

Question Has Been Solved by an Expert!
Get step-by-step solutions from verified subject matter experts
Step: 2 Unlock
Step: 3 Unlock