

Question: quality management, please help!! additional information- thank you! range 20 Find the LCL CL and UCL for the R chart show wark) (5 points) LCL
quality management, please help!! 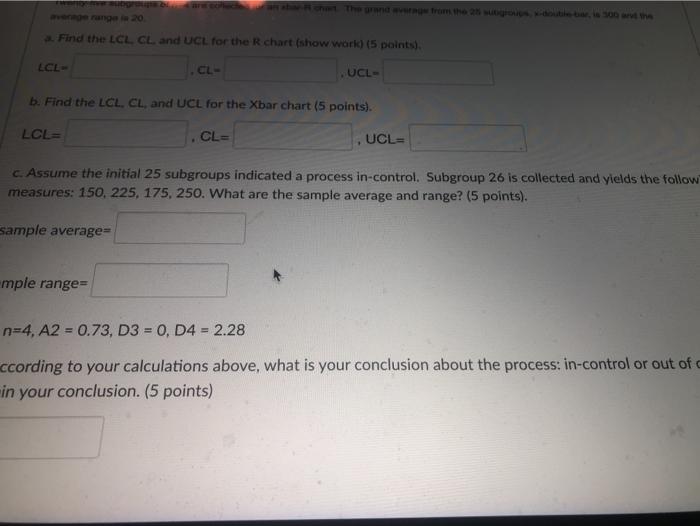
additional information- thank you! 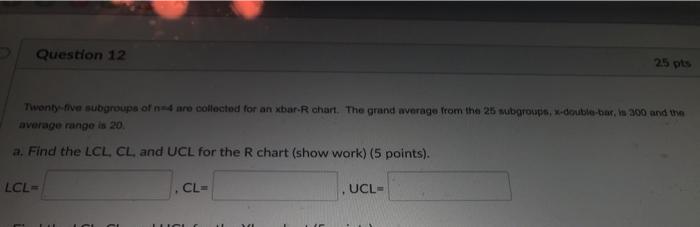
Step by Step Solution
There are 3 Steps involved in it
1 Expert Approved Answer
Step: 1 Unlock

Question Has Been Solved by an Expert!
Get step-by-step solutions from verified subject matter experts
Step: 2 Unlock
Step: 3 Unlock