

Question: Question 1: 50/50 Rule Based on the above Gantt chart, the data given below, and by using the 50/50 rule - complete the Earned Value
Question 1: 50/50 Rule
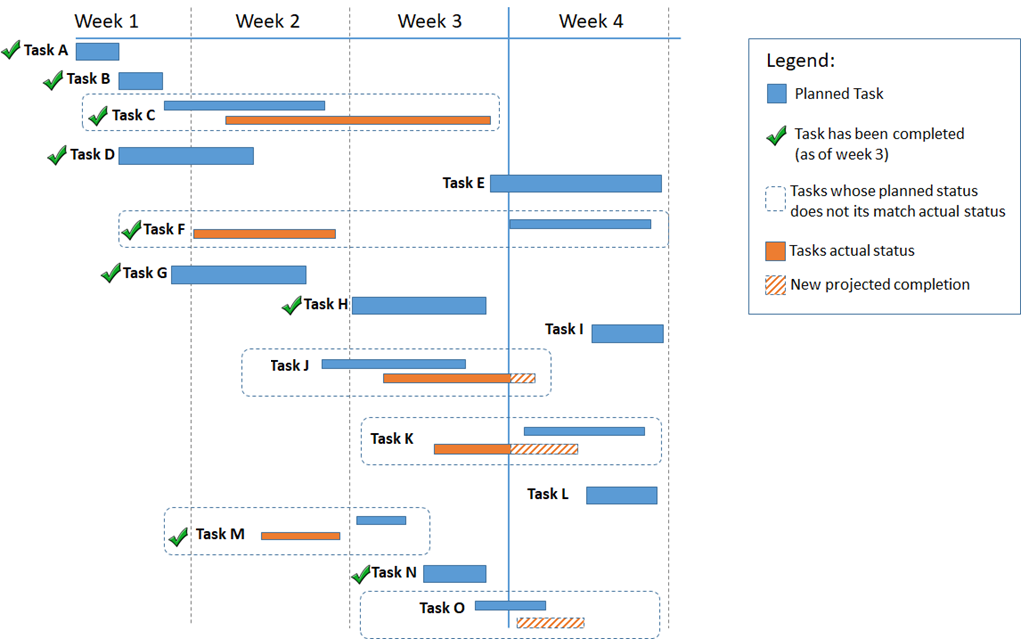
Based on the above Gantt chart, the data given below, and by using the 50/50 rule - complete the Earned Value table for tasks A, C, F, J, K M and O.
Planned ValueActual CostsEarned ValueNotes.Use the 50/50 rule to determine how much value was earned. Task A$3,000$1,000$3000$3000 x 100% = $3000. Task completed on time. Using to 50/50 rule, the value earned for this task is 100%Task C$10,000$7,000$10,000$10,000 x 100% = $10,000. Task completed one week over schedule. Using to 50/50 rule, the value earned for this task is 100%Task F$4,000$2,500$4000$4000 x 100% = $4000. Task completed ahead of schedule by two. Using the 50/50 rule, the value earned for this task is 100%Task J$6,000$2,000$3000$6000 x 50% = $3000. Task not completed to schedule. Therefore, using the 50/50 rule, this task has earned 50% value.Task K$8,000$7,000$4000$8000 x 50% = $4000. The task began ahead of schedule and is not completed. Therefore, using the 50/50 rule, this task has earned 50% value.Task M$3,000$3,500$3000$3000 x 100% = $3000. The task was started and completed ahead of schedule. The value earned for this task is 100% using the 50/50 rule.Task O$3,000$0$0$3000 x 0% = $0. This task is behind schedule and has not been started. Therefore, using the 50/50 rule the value earned is $0 because the task has not begun.
Question 2: Calculate Earned Value Indicators
Based on the following data:
The Budget At Completion (BAC) cost of the project is estimated to be: $52,250.
- Earned value data is available for the first three weeks of the project (see below).
- The project is due to end on week four (4).
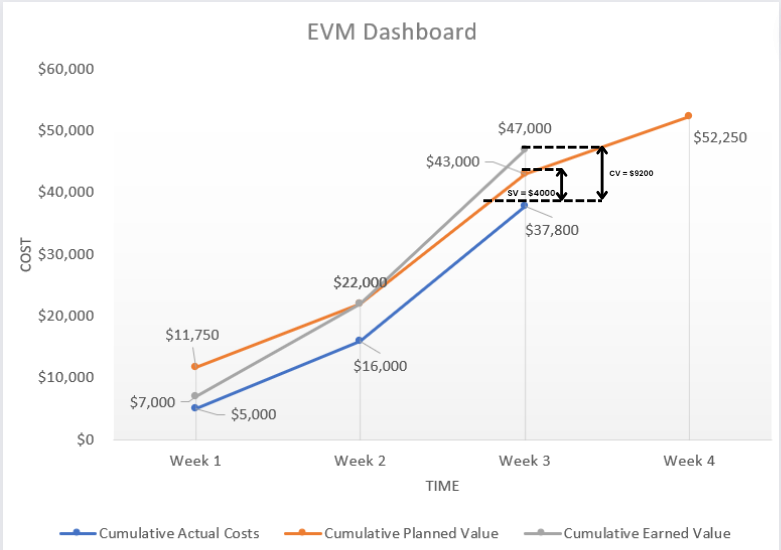
$5,000$16,000$37,800 Cumulative Planned Value$11,750$22,000$43,000$52,250Cumulative Earned Value$7,000$22,000$47,000
Based on the above data, calculate the following earned value indicators:
EVM IndicatorWeek 1Week 2Week 3Formula usedCost Variance7000 5000
CV = $2000
22,000 16,000
CV = $6000
47,000 37,800
CV = $9200
CV = EV AC
Schedule Variance
7000 11,750
SV = -$4750
22,000 22,000
SV = 0
47,000 43,000
SV = $4000
SV = EV PVCost Performance Index
7000/5000
CPI = 1.4
22,000/16,000
CPI = 1.375
47,000/37,800
CPI = 1.2434
CPI = EV/AC
Schedule Performance Index
7000/11,750
SPI = 0.5957
22,000/22,000
SPI = 1
47,000/43,000
SPI = 1.093
SPI = EV/PV
Estimated Cost At Completion
(use the EAC = BAC / CPI formula)
52,250/1.4
EAC = $37,321.43
52,250/1.375
EAC = $38,000
52,250/1.2434
EAC = $42,021.87
EAC = BAC/CPI
Estimated Cost to Complete
37,321.43 5000
ETC = $32,321.43
38,000 16,000
ETC = $22,000
42,021.87 37,800
ETC = $4221.87
ETC = EAC AC
Question 3: Earned Value Management Dashboard
Question 4: Interpret the Projects Status
- What is the current week three (3) status of the project?
- Is the project on schedule, behind schedule or ahead of schedule?
- Is the project on budget, under budget or over budget?
- If progress continues at its current rate how much will the project likely cost?
- Ensure that you reference the earned value terms and findings in your answer.
Legend: Planned Task Task has been completed (as of week 3) Tasks whose planned status does not its match actual status Tasks actual status New projected completion cilan narhhoned Legend: Planned Task Task has been completed (as of week 3) Tasks whose planned status does not its match actual status Tasks actual status New projected completion cilan narhhoned
Step by Step Solution
There are 3 Steps involved in it

Get step-by-step solutions from verified subject matter experts