

Question: Question 1 Consider the Analytics Exercise: Forecasting Supply Chain Demand-Starbucks Corporation at the end of Chapter18 in your course textbook. Open a blank Excel workbook,
Question 1
Consider the "Analytics Exercise: Forecasting Supply Chain Demand-Starbucks Corporation" at the end of Chapter18 in your course textbook. Open a blank Excel workbook, and rename the second tab as Q1starbuck-partA. The remaining tabs should be renamed as Q1starbuck-partB, Q1starbuck-partC, Q1starbuck-partD, Q1starbuck-partE, and Q1starbuck-partF. The following questions should be analyzed in Excel and answered using textboxes in the same tab.
Part A
You will develop simple moving average forecast based on the past 5 weeks and the past 3 weeks of data and find the MAD, MSE, MAPE, and tracking signal of your forecast. Which forecast, the 5-week or the 3-week, is more accurate for each of the distribution centres? Provide a rationale for its better accuracy for that particular warehouse using a text box.
Part B
Following the question on the next page of the exercise in your textbook, you will develop exponential smoothing forecast based on alpha = 0.2 and alpha = 0.4 and find the MAD, MSE, MAPE, and tracking signal of your forecast. Which forecast, alpha=0.2 or alpha =0.4, is more accurate for each of the distribution centres? Which value of alpha emphasizes more on the past data?
Part C
Starbucks is planning to consolidate the five distribution centres into one with the aggregated demand represented by the total row. Perform forecasts for the 3-week moving average, 5-week moving average, 0.2 alpha exponential smoothing, and 0.4 alpha exponential smoothing on the aggregated total demand. After comparing the results and accuracy measures, provide a rationale on which of these four forecasting methods you would recommend to Starbucks.
Part D
Starbucks also wants you to develop a linear regression model based on the total demand data for Week -1 to -5. Use this model to predict the total aggregated demand for Week 1 to Week 13, and find the forecast accuracy in terms of MAD, MSE, and MAPE. Does linear regression outperform your suggested method in Part C of this question in terms of accuracy measures?
Part E
Discuss any two pros and two cons of aggregating demand of these five distribution centres.
Part F
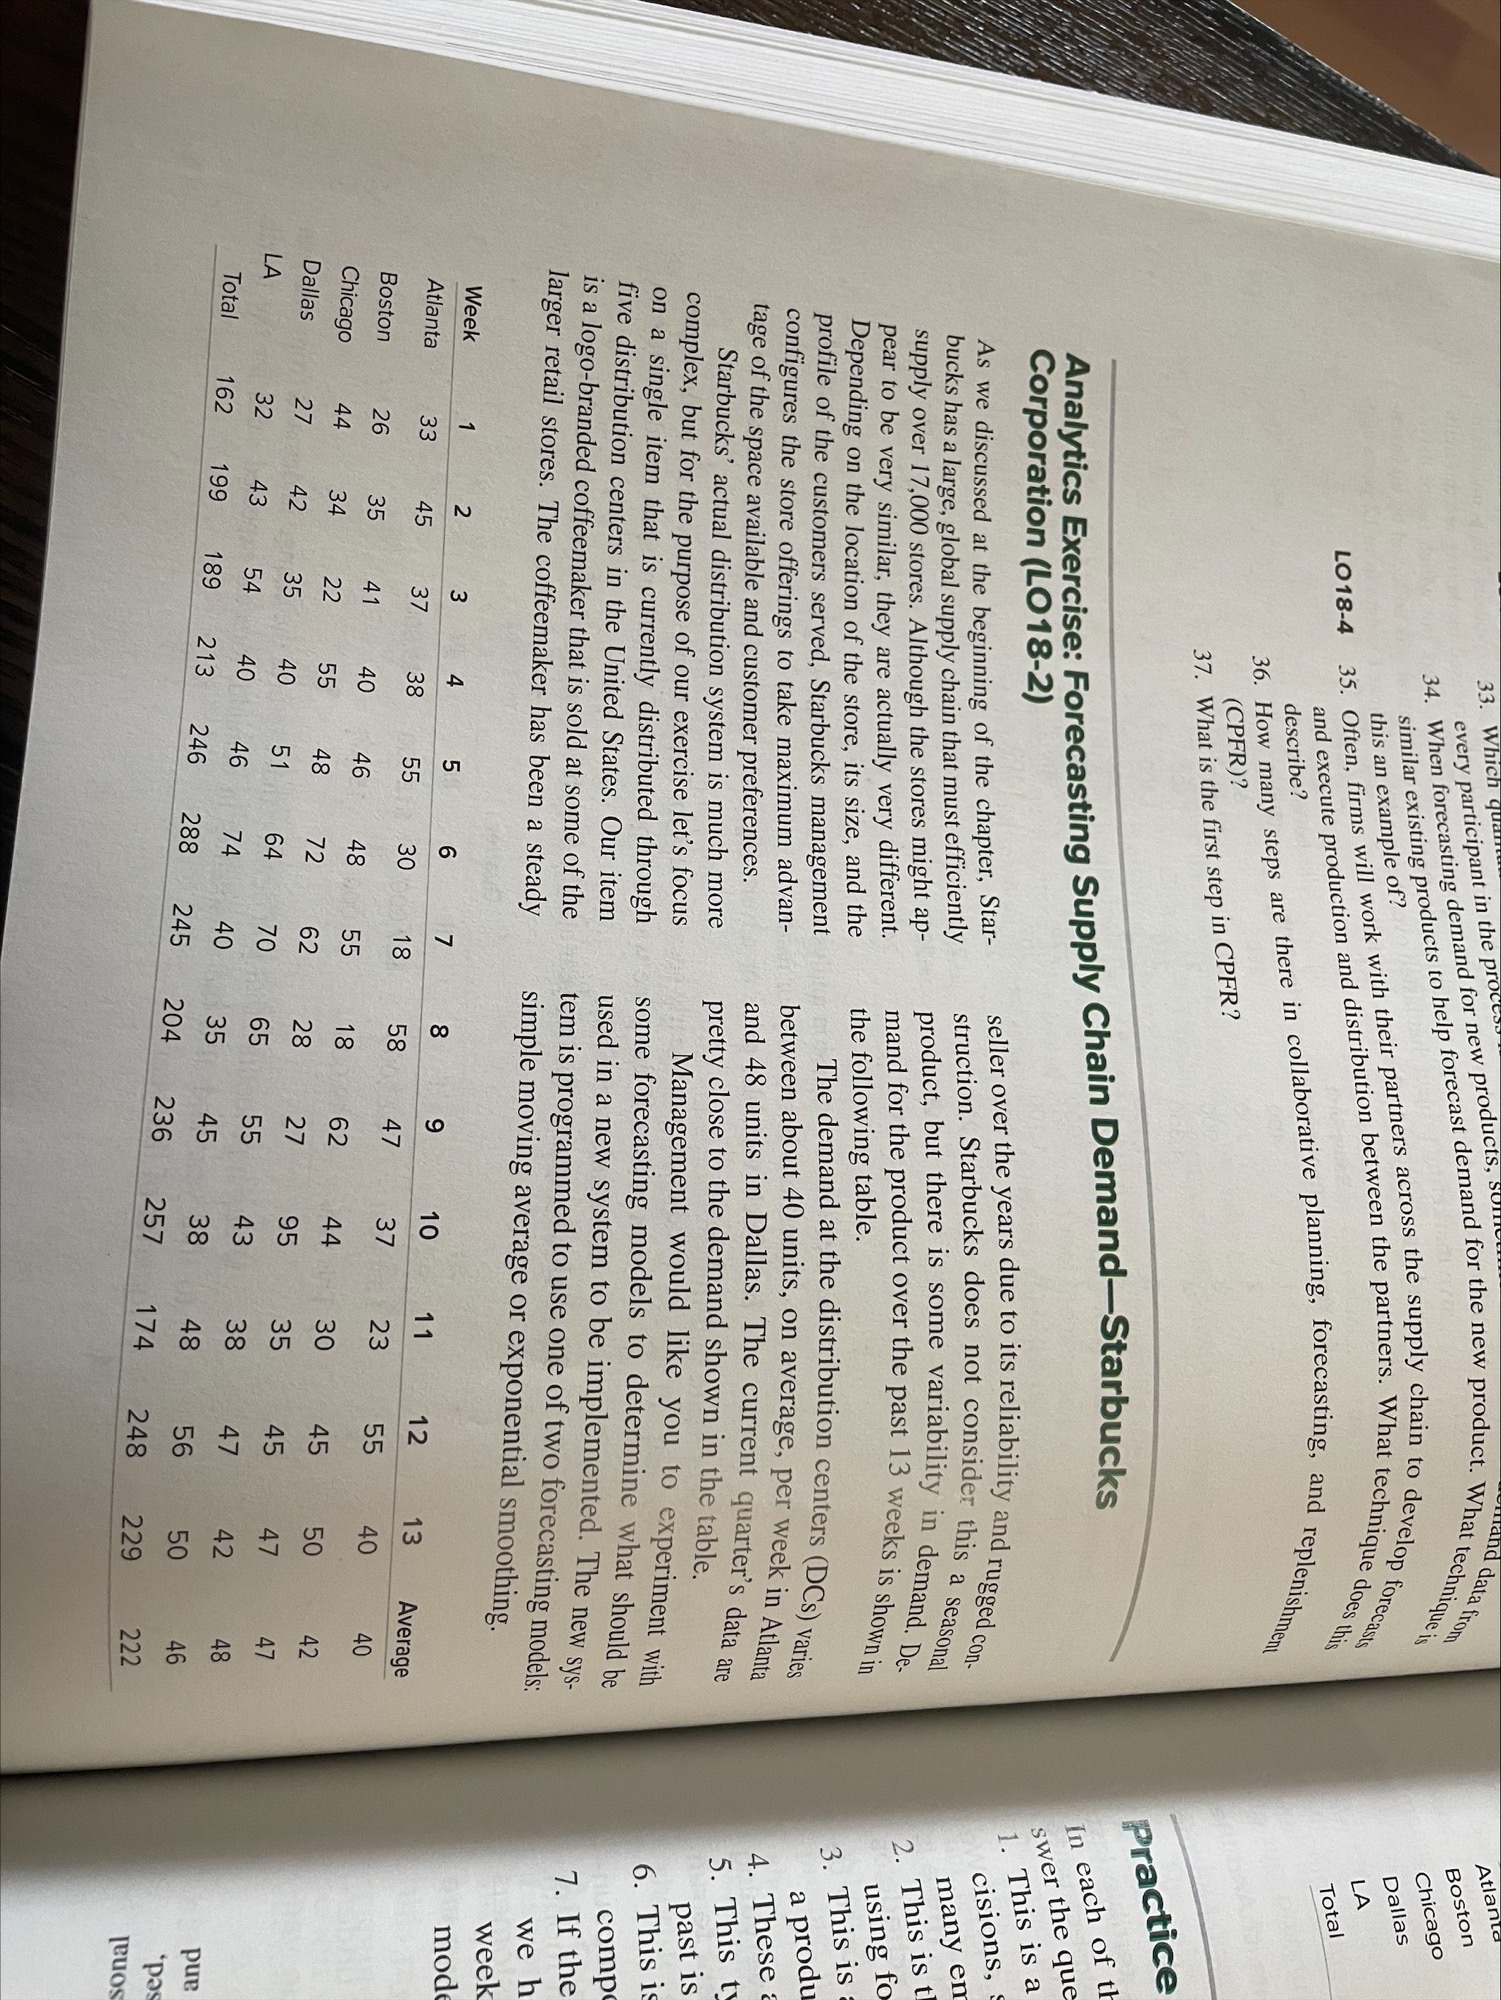
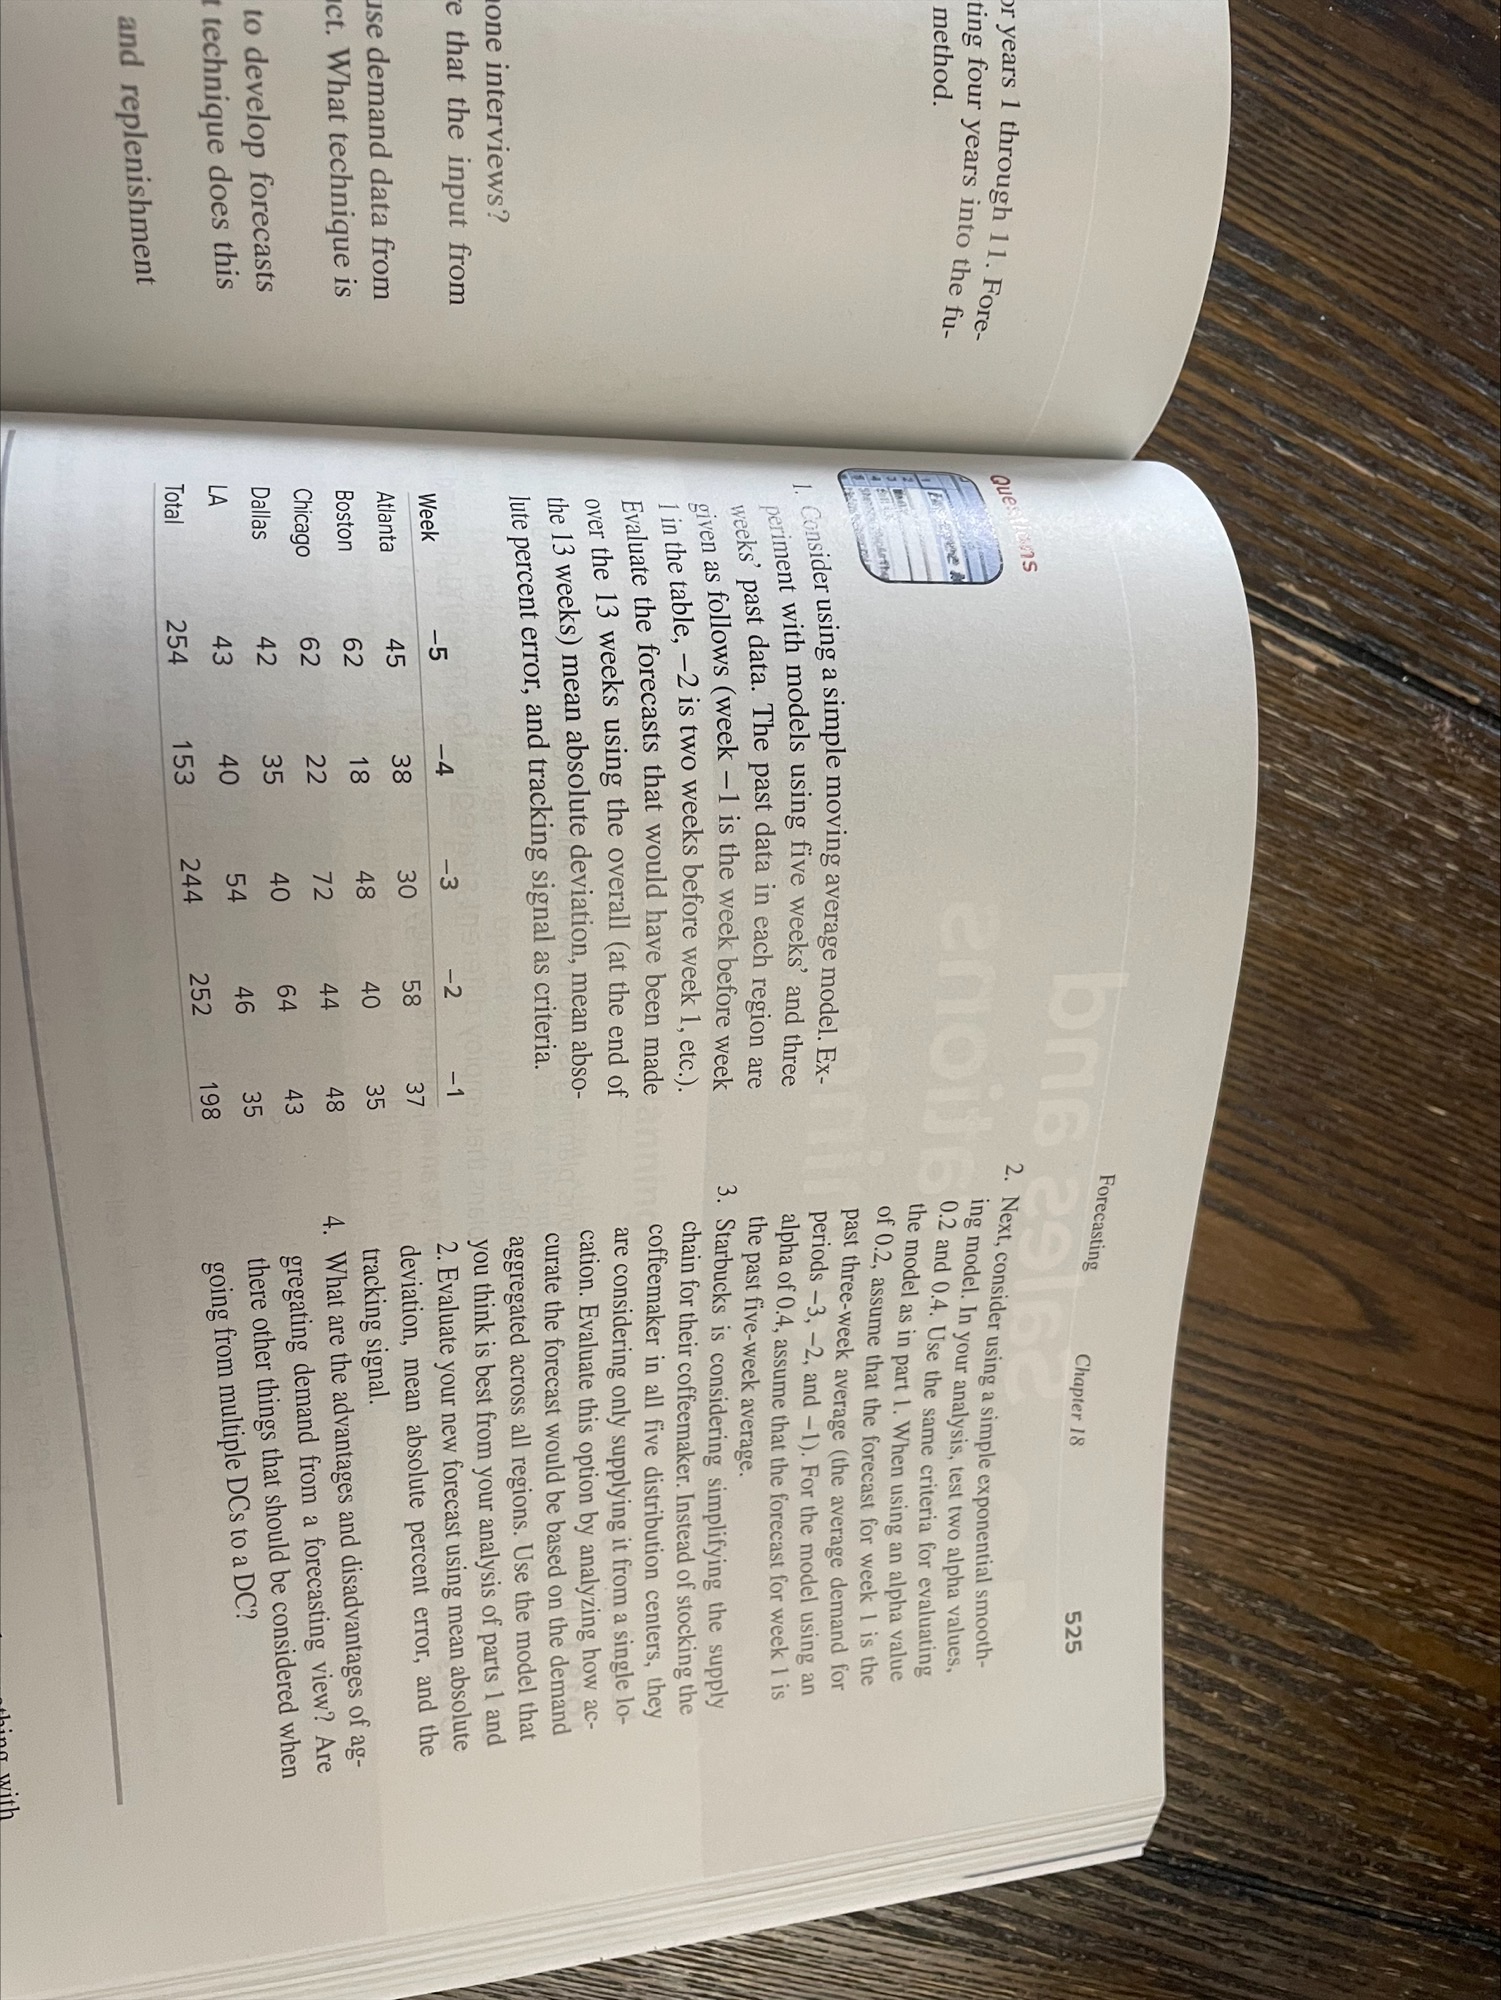
Week Atlanta As we discussed at the beginning of the chapter, Star- bucks has a large, global supply chain that must efficiently supply over 17,000 stores. Although the stores might ap- pear to be very similar, they are actually very different. Depending on the location of the store, its size, and the profile of the customers served, Starbucks management configures the store offerings to take maximum advan- tage of the space available and customer preferences. Starbucks' actual distribution system is much more complex, but for the purpose of our exercise let's focus on a single item that is currently distributed through five distribution centers in the United States. Our item is a logo-branded coffeemaker that is sold at some of the larger retail stores. The coffeemaker has been a steady Total Analytics Exercise: Forecasting Supply Chain Demand-Starbucks Corporation (LO18-2) 1 33 Boston 26 Chicago 44 Dallas 27 LA 32 162 2 45 LO18-4 35 34 42 43 199 3 37 and data from 33. Which quan every participant in the process 34. When forecasting demand for new products, somet this an example of? similar existing products to help forecast demand for the new product. What technique is 35. Often, firms will work with their partners across the supply chain to develop forecasts and execute production and distribution between the partners. What technique does this 36. How many steps are there in collaborative planning, forecasting, and replenishment describe? (CPFR)? 37. What is the first step in CPFR? 41 22 35 54 189 4 38 5 55 40 46 55 48 40 51 40 46 213 246 6 30 48 72 64 74 288 7 1581 55 62 70 40 245 con- struction. Starbucks does not consider this a seasonal seller over the years due to its reliability and rugged product, but there is some variability in demand. De- mand for the product over the past 13 weeks is shown in the following table. The demand at the distribution centers (DCs) varies between about 40 units, on average, per week in Atlanta and 48 units in Dallas. The current quarter's data are pretty close to the demand shown in the table. Management would like you to experiment with some forecasting models to determine what should be used in a new system to be implemented. The new sys- tem is programmed to use one of two forecasting models: simple moving average or exponential smoothing. 8 58 18 28 65 35 204 9 47 62 27 55 45 236 10 37 44 95 43 38 257 11 23 30 35 38 48 174 12 55 45 45 47 56 248 13 40 50 47 42 50 229 Average 40 42 47 48 46 222 Atlanta Boston Chicago Dallas LA Total Practice In each of th swer the ques 1. This is a cisions, s many em 2. This is th using fo 3. This is a a produ 4. These a 5. This ty past is 6. This is compc 7. If the we h week mode pue 'pas BUOS
Step by Step Solution
There are 3 Steps involved in it
To address the questions presented lets break down each part and outline the steps needed to analyze and answer them in Excel Part A Simple Moving Average Forecast Open an Excel workbook and create a ... View full answer

Get step-by-step solutions from verified subject matter experts