

Question: QUESTION 1 The table below (Table 8.9, BMA) shows the correlation between returns of 7 different stocks. How likely is it that an equally weighted
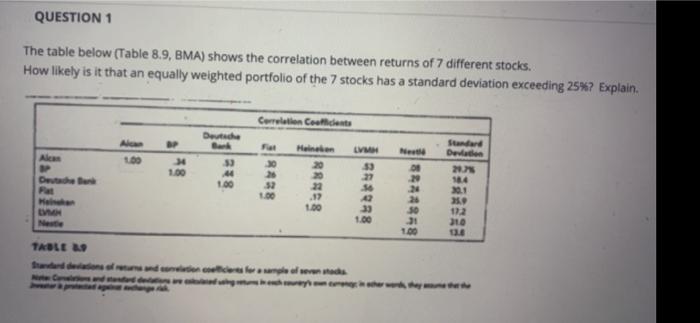
QUESTION 1 The table below (Table 8.9, BMA) shows the correlation between returns of 7 different stocks. How likely is it that an equally weighted portfolio of the 7 stocks has a standard deviation exceeding 25%? Explain. Correlation Coalicients Deutsche Alca 100 Halina 20 Standard Deva 20 Fall 2 1.00 so 22 .17 1.00 20 24 20 50 31 100 201 250 112 310 1.00 TABLE QUESTION 1 The table below (Table 8.9, BMA) shows the correlation between returns of 7 different stocks. How likely is it that an equally weighted portfolio of the 7 stocks has a standard deviation exceeding 25%? Explain. Correlation Coalicients Deutsche Alca 100 Halina 20 Standard Deva 20 Fall 2 1.00 so 22 .17 1.00 20 24 20 50 31 100 201 250 112 310 1.00 TABLE
Step by Step Solution
There are 3 Steps involved in it

Get step-by-step solutions from verified subject matter experts