

Question: The table below (Table 8.9, BMA) shows the correlation between returns of 7 different stocks. How likely is it that an equally weighted portfolio of
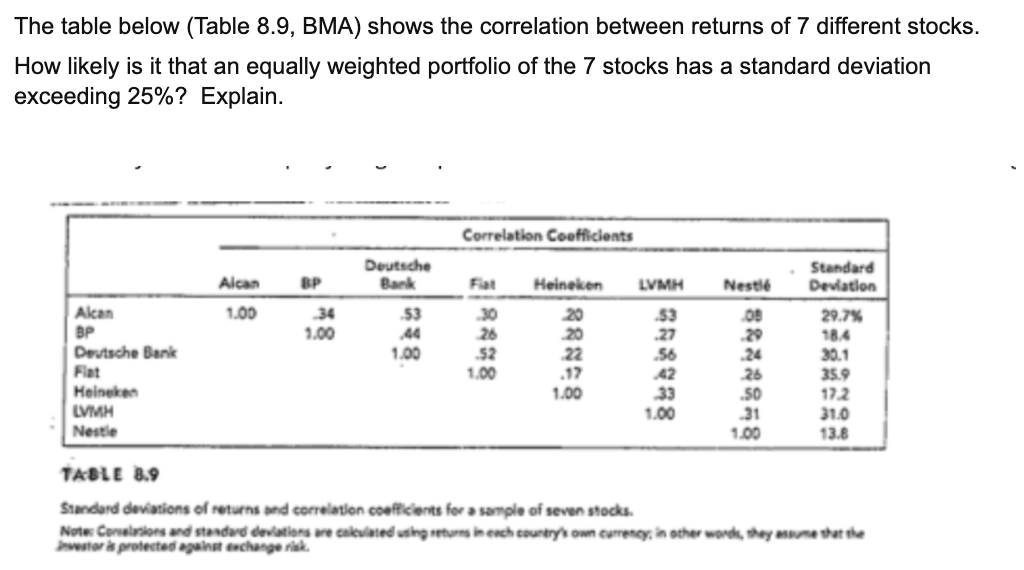
The table below (Table 8.9, BMA) shows the correlation between returns of 7 different stocks. How likely is it that an equally weighted portfolio of the 7 stocks has a standard deviation exceeding 25%? Explain. Correlation Coofficients Deutsche Bank Heineken LVMH Nestle Alcan 1.00 53 00 Alcan BP Deutsche Bank 1.00 1.00 26 52 1.00 20 22 53 .27 .56 42 33 1.00 Standard Deviation 29.7% 18.4 30.1 35.9 17.2 31.0 13.8 n 1.00 Heineken LVMH Nestle 26 .50 31 1.00 TABLE 8.9 Standard deviations of returns and correlation coefficients for sample of seven stocks. Notes Colors and standard deviations we calculated using returnerch country own currency in other words they were Inwestor protected against exchange rak
Step by Step Solution
There are 3 Steps involved in it

Get step-by-step solutions from verified subject matter experts