

Question: The table below (Table 8.9,BMA) shows the correlation between returns of 7 different stocks, How likely is it that an equally weighted portfolio of the
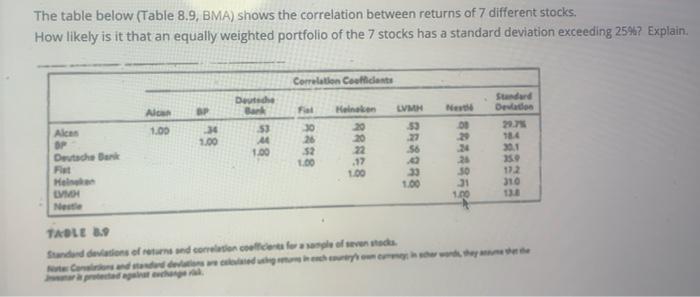
The table below (Table 8.9,BMA) shows the correlation between returns of 7 different stocks, How likely is it that an equally weighted portfolio of the 7 stocks has a standard deviation exceeding 25%? Explain. Correlation Confidente Deutsche Standard Devo BP LVMH New Als 1.00 53 1.00 Fall 30 26 52 100 Heineken 20 20 22 .17 1.00 Alca OP Deutsche Bank Fle Mol 134 301 1.00 *988 310 31 1.00 Net TABLE 3 Sandovaons of returns and correlation coefficience of events The table below (Table 8.9,BMA) shows the correlation between returns of 7 different stocks, How likely is it that an equally weighted portfolio of the 7 stocks has a standard deviation exceeding 25%? Explain. Correlation Confidente Deutsche Standard Devo BP LVMH New Als 1.00 53 1.00 Fall 30 26 52 100 Heineken 20 20 22 .17 1.00 Alca OP Deutsche Bank Fle Mol 134 301 1.00 *988 310 31 1.00 Net TABLE 3 Sandovaons of returns and correlation coefficience of events
Step by Step Solution
There are 3 Steps involved in it

Get step-by-step solutions from verified subject matter experts