

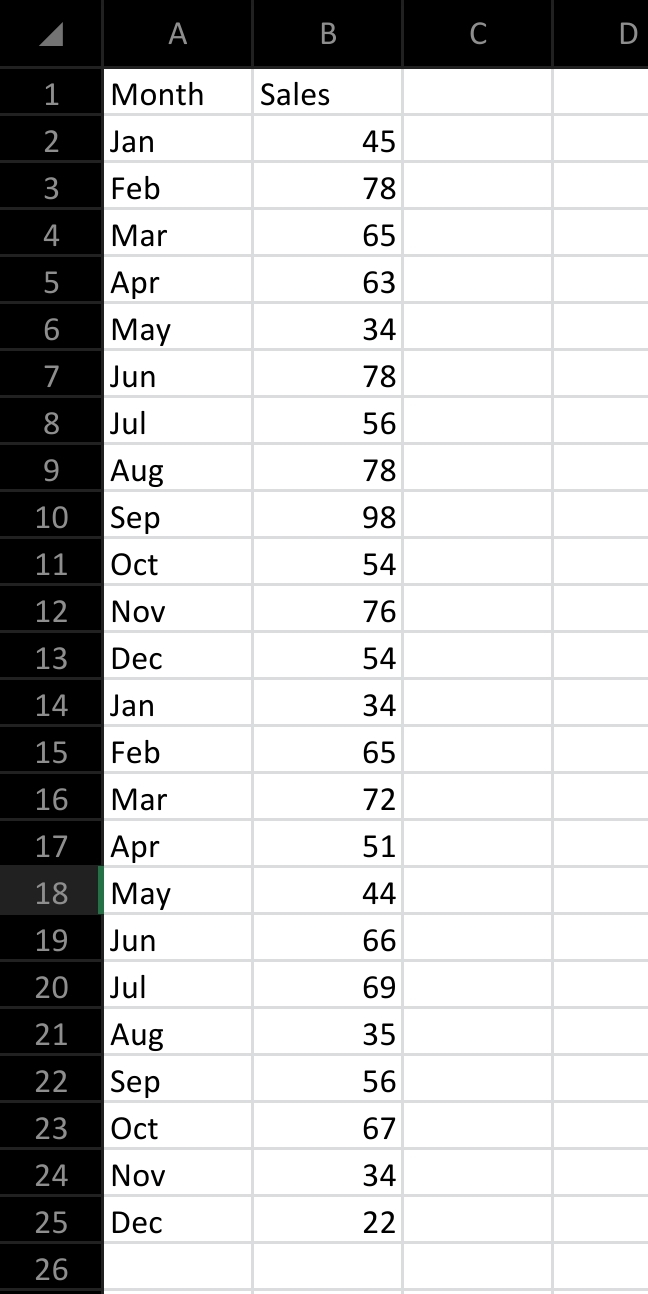
Question: Question # 1 Use the attached sales data to do a 4 month and 6 month moving average using Excel. Present your data in both
Question #
Use the attached sales data to do a month and month moving average using Excel. Present your data in both table form and using a graph.
What differences do you see in the two curves?
Calculate the expected error MAD in the curves. What is the difference and how would affect your decisions on the two forecasting models?
Question #
Use the same data to perform an exponential smoothing, using an alpha of and Present both tables and graphs of your data.
How does your answer change with the differing alphas Which model would you choose and why?
What is the difference in using either model for your forecasting?
AMonthbrBSalesCD
Step by Step Solution
There are 3 Steps involved in it
1 Expert Approved Answer
Step: 1 Unlock

Question Has Been Solved by an Expert!
Get step-by-step solutions from verified subject matter experts
Step: 2 Unlock
Step: 3 Unlock