

Question: . Question 12 A boxplot for a sample data is shown below. There are no outliers. 17 31 145 20 40 60 80 100 120
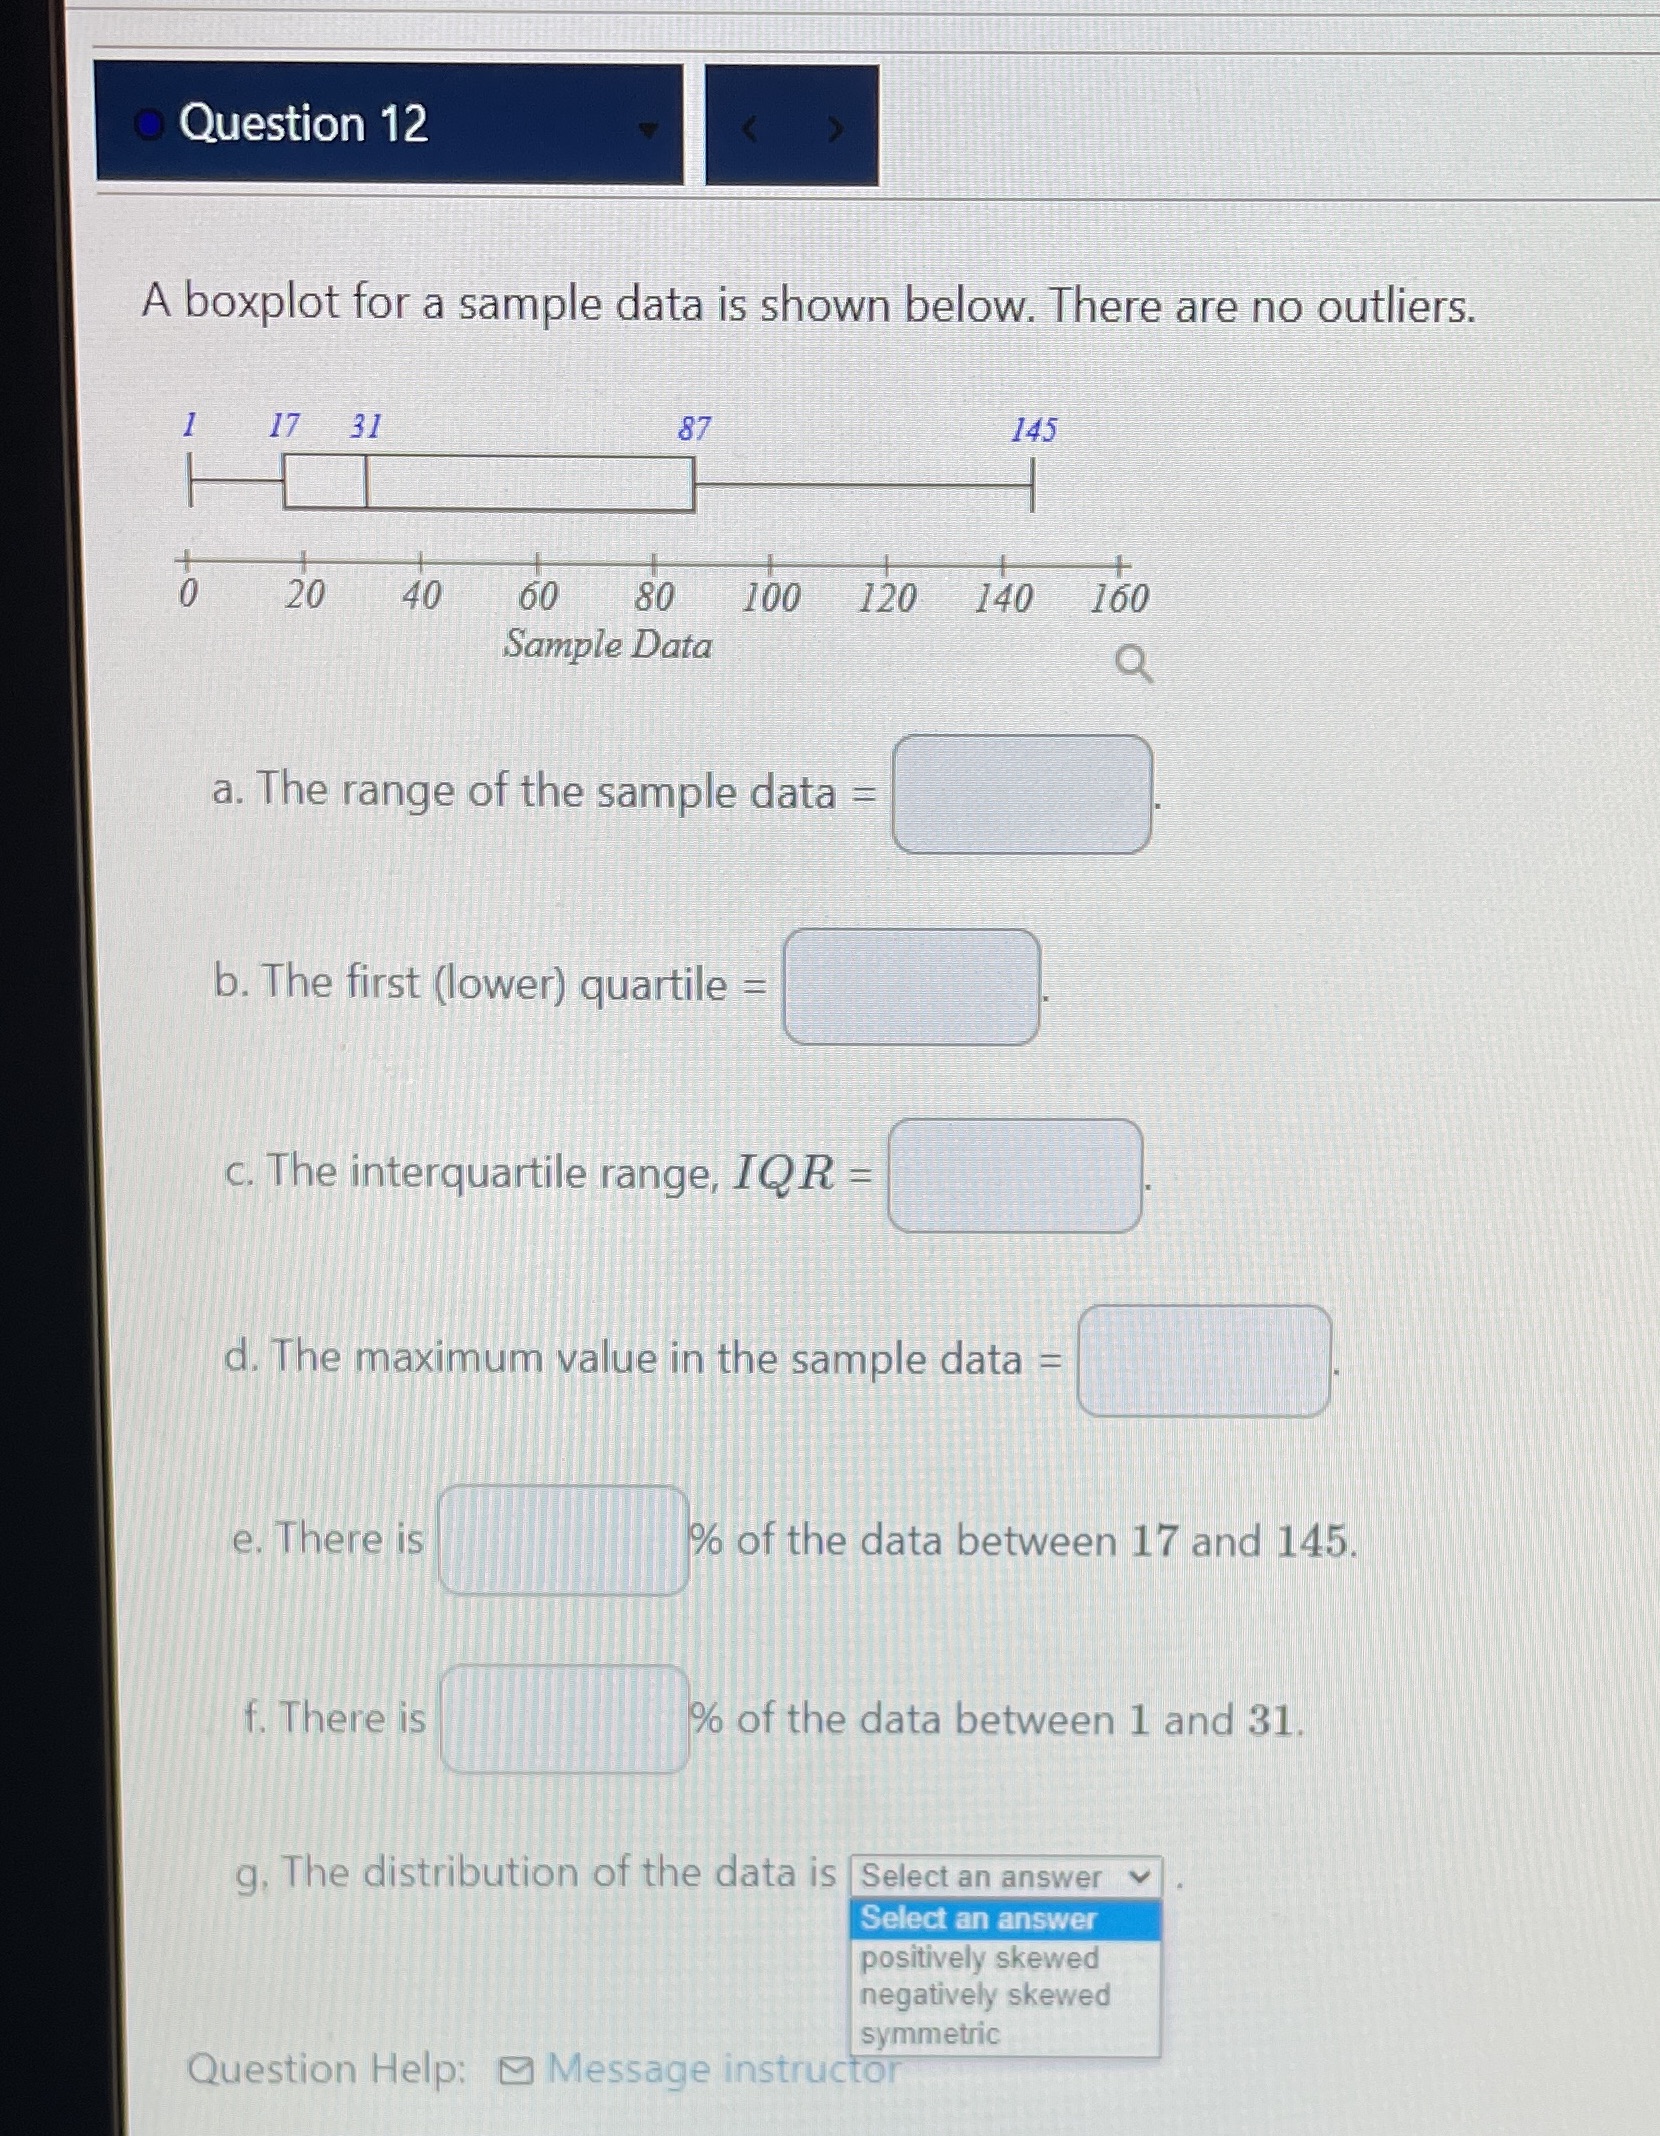
. Question 12 A boxplot for a sample data is shown below. There are no outliers. 17 31 145 20 40 60 80 100 120 140 160 Sample Data Q a. The range of the sample data = b. The first (lower) quartile = c. The interquartile range, IQR = d. The maximum value in the sample data e. There is o of the data between 17 and 145. f. There is % of the data between 1 and 31. g, The distribution of the data is |Select an answer Select an answer positively skewed negatively skewed symmetric Question Help: Message instructor
Step by Step Solution
There are 3 Steps involved in it
1 Expert Approved Answer
Step: 1 Unlock

Question Has Been Solved by an Expert!
Get step-by-step solutions from verified subject matter experts
Step: 2 Unlock
Step: 3 Unlock