

Question: Question 2 (12 points) Saved A) Using Figure 1 information, calculate the Percentage of Perfect Orders for each of the companies being considered. You MUST
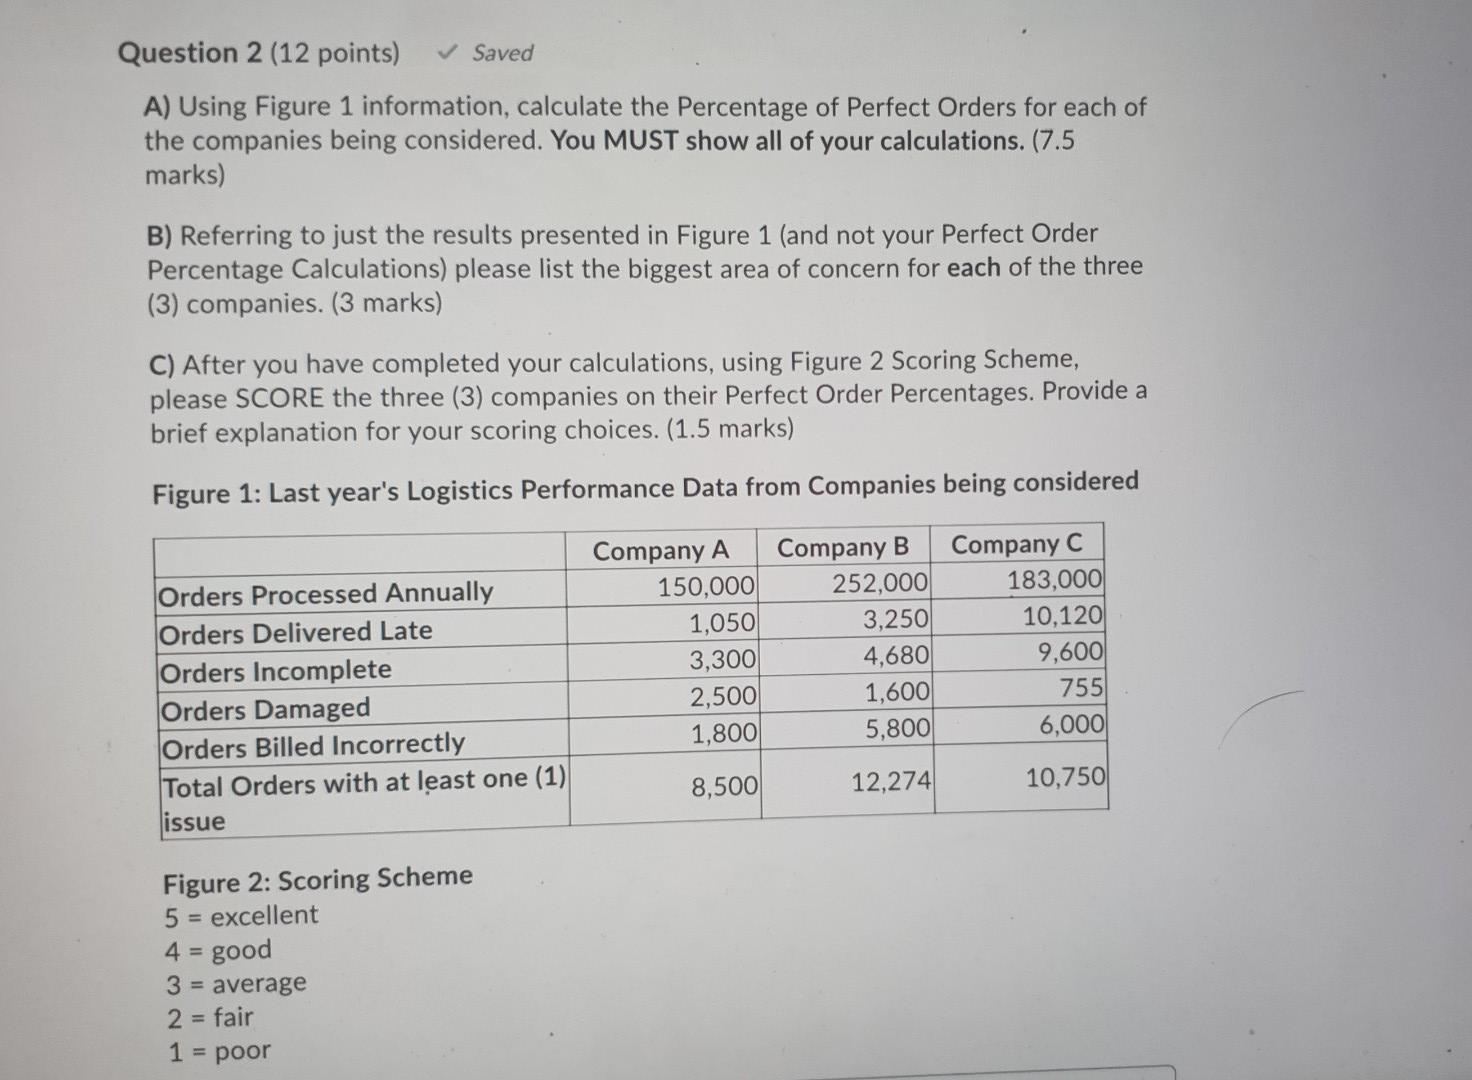
Question 2 (12 points) Saved A) Using Figure 1 information, calculate the Percentage of Perfect Orders for each of the companies being considered. You MUST show all of your calculations. (7.5 marks) B) Referring to just the results presented in Figure 1 (and not your Perfect Order Percentage Calculations) please list the biggest area of concern for each of the three (3) companies. (3 marks) C) After you have completed your calculations, using Figure 2 Scoring Scheme, please SCORE the three (3) companies on their Perfect Order Percentages. Provide a brief explanation for your scoring choices. (1.5 marks) Figure 1: Last year's Logistics Performance Data from Companies being considered Orders Processed Annually Orders Delivered Late Orders Incomplete Orders Damaged Orders Billed Incorrectly Total Orders with at least one (1) issue Company A 150,000 1,050 3,300 2,500 1,800 Company B 252,000 3,250 4,680 1,600 5,800 Company C 183,000 10,120 9,600 755 6,000 8,500 12,274 10,750 Figure 2: Scoring Scheme 5 = excellent 4 = good 3 = average 2 = fair 1 = poor
Step by Step Solution
There are 3 Steps involved in it
1 Expert Approved Answer
Step: 1 Unlock

Question Has Been Solved by an Expert!
Get step-by-step solutions from verified subject matter experts
Step: 2 Unlock
Step: 3 Unlock