

Question: Question 2, 3.3.2 HW Score: 75%, 6 of 8 points O Save Part 1 of 2 x Points: 0 of 1 The accompanying frequency distribution
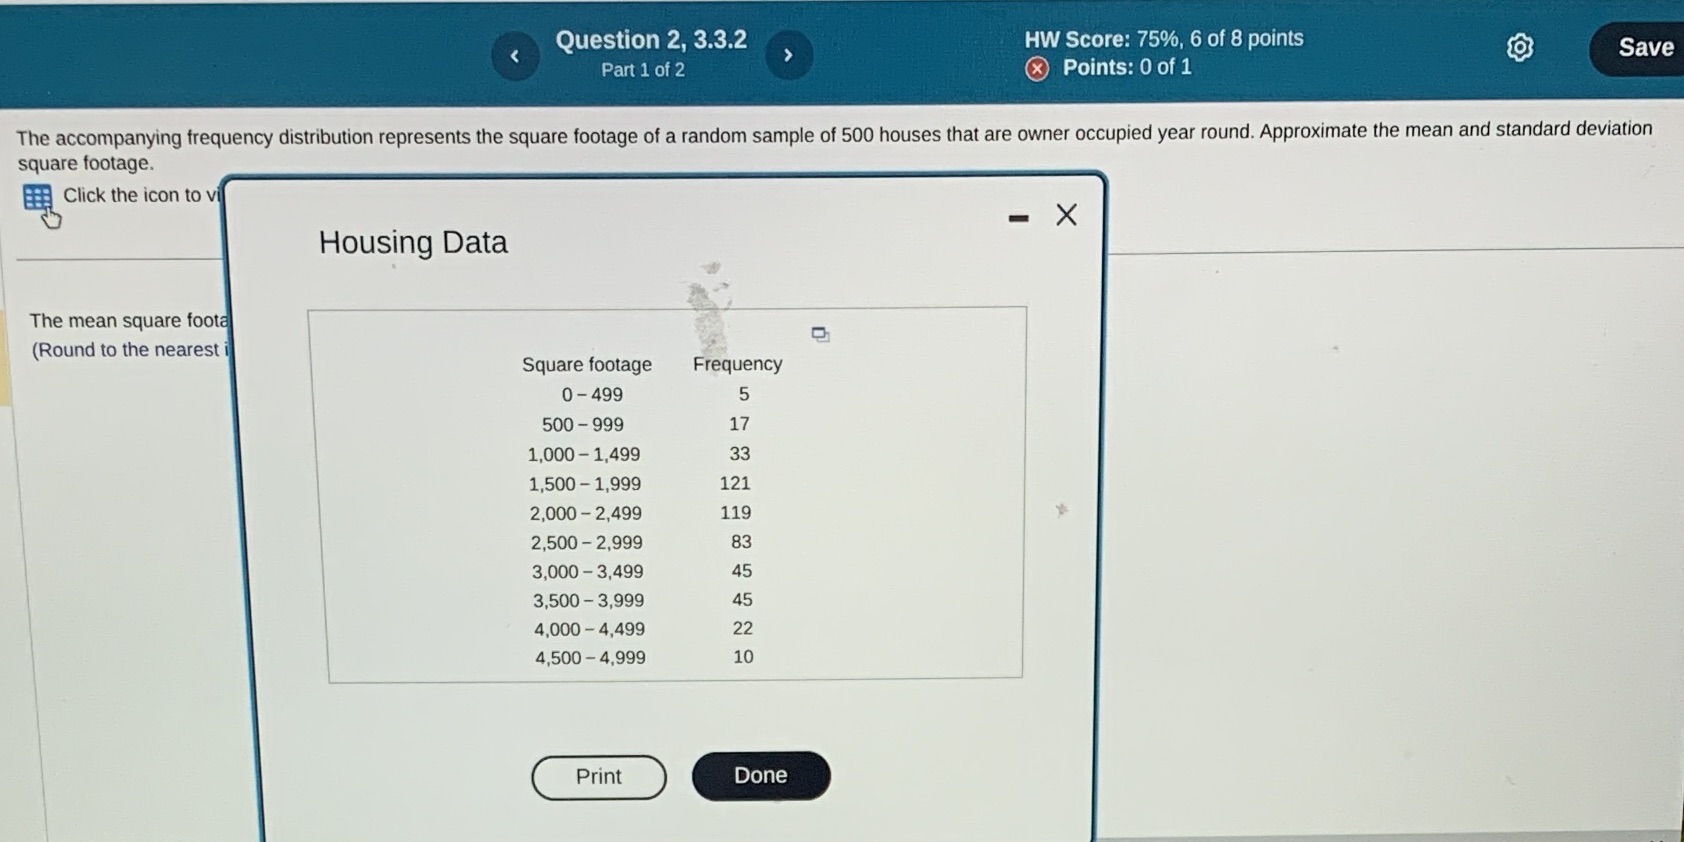
Question 2, 3.3.2 HW Score: 75%, 6 of 8 points O Save Part 1 of 2 x Points: 0 of 1 The accompanying frequency distribution represents the square footage of a random sample of 500 houses that are owner occupied year round. Approximate the mean and standard deviation square footage. Click the icon to vi X Housing Data The mean square foota (Round to the nearest Square footage Frequency 0 - 499 5 500- 999 17 1,000 - 1,499 33 1,500 - 1,999 121 2,000 - 2,499 119 2,500 - 2,999 83 3,000 - 3,499 45 3,500 - 3,999 45 4,000 - 4,499 22 4,500 - 4,999 10 Print Done
Step by Step Solution
There are 3 Steps involved in it
1 Expert Approved Answer
Step: 1 Unlock

Question Has Been Solved by an Expert!
Get step-by-step solutions from verified subject matter experts
Step: 2 Unlock
Step: 3 Unlock