

Question: Question 2 part 1. (15 points) Use the following data in order to calculate the mean (average return), variance, and standard deviation for the
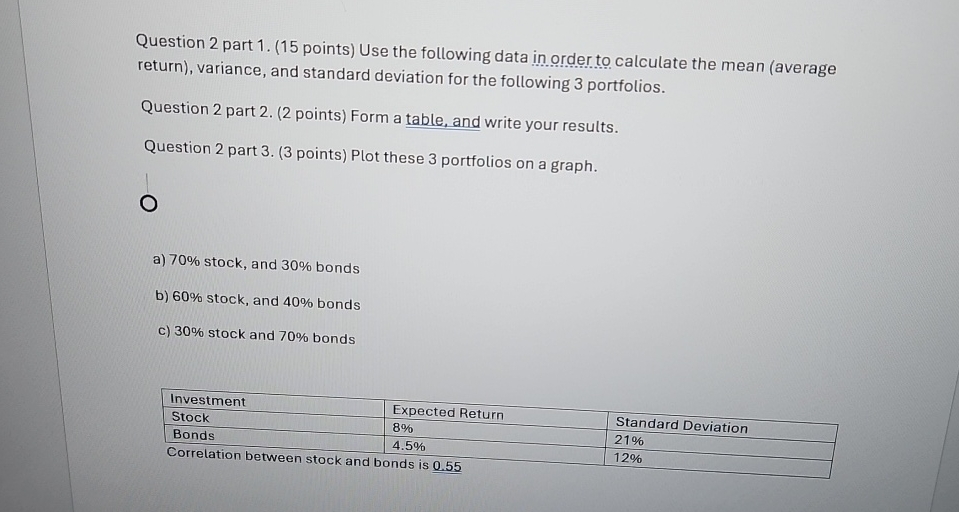
Question 2 part 1. (15 points) Use the following data in order to calculate the mean (average return), variance, and standard deviation for the following 3 portfolios. Question 2 part 2. (2 points) Form a table, and write your results. Question 2 part 3. (3 points) Plot these 3 portfolios on a graph. a) 70% stock, and 30% bonds b) 60% stock, and 40% bonds c) 30% stock and 70% bonds Investment Stock Bonds Expected Return Standard Deviation 8% 4.5% 21% 12% Correlation between stock and bonds is 0.55
Step by Step Solution
There are 3 Steps involved in it
1 Expert Approved Answer
Step: 1 Unlock

Question Has Been Solved by an Expert!
Get step-by-step solutions from verified subject matter experts
Step: 2 Unlock
Step: 3 Unlock