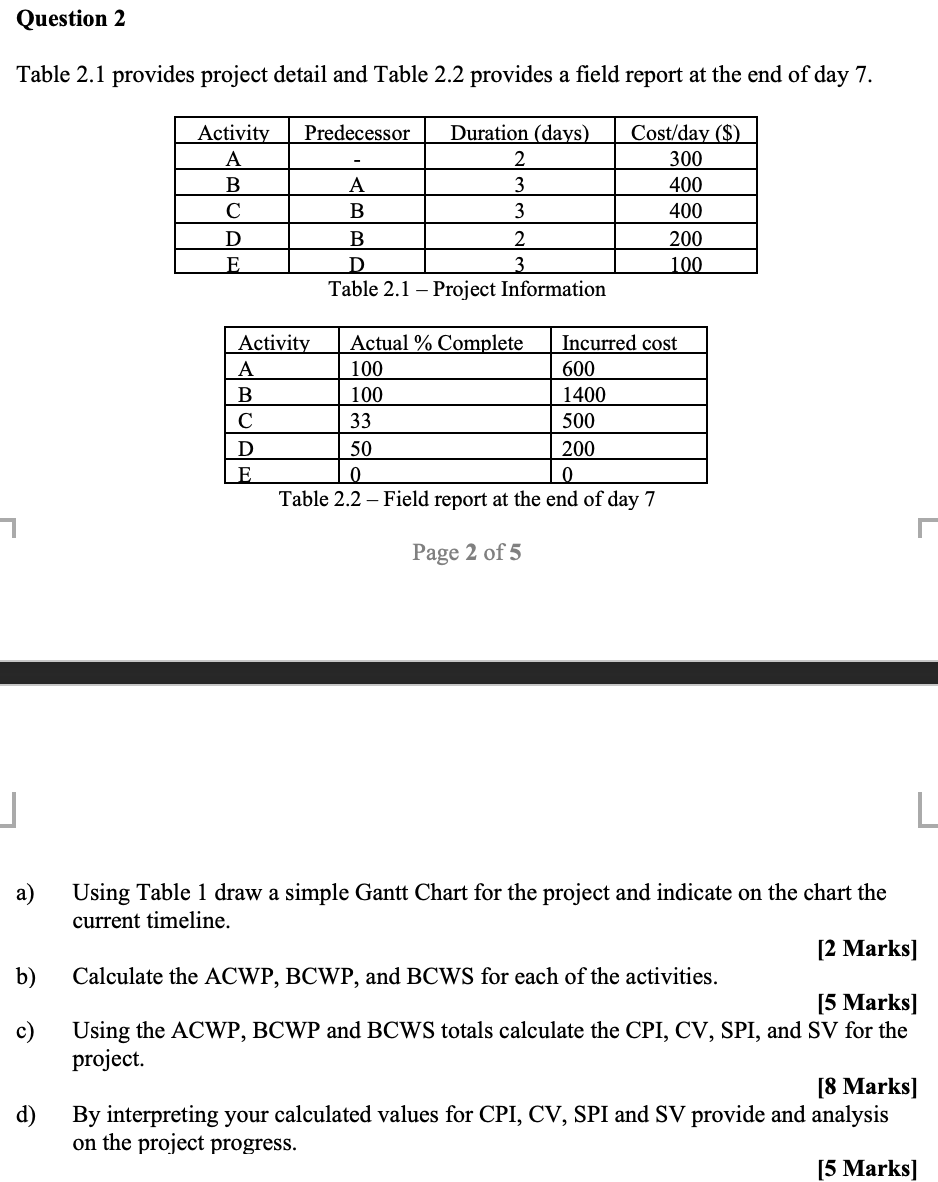
Question: Question 2 Table 2.1 provides project detail and Table 2.2 provides a field report at the end of day 7. Activity A B D E

Question 2 Table 2.1 provides project detail and

Question 2 Table 2.1 provides project detail and Table 2.2 provides a field report at the end of day 7. Activity A B D E Predecessor Duration (days) 2 A 3 B 3 B 2 D 3 Table 2.1 - Project Information Cost/day ($) 300 400 400 200 100 Activity Actual % Complete Incurred cost A 100 600 B 100 1400 33 500 D 50 200 E 0 0 Table 2.2 - Field report at the end of day 7 Page 2 of 5 | a) b) c) Using Table 1 draw a simple Gantt Chart for the project and indicate on the chart the current timeline. [2 Marks] Calculate the ACWP, BCWP, and BCWS for each of the activities. [5 Marks] Using the ACWP, BCWP and BCWS totals calculate the CPI, CV, SPI, and SV for the project. [8 Marks] By interpreting your calculated values for CPI, CV, SPI and SV provide and analysis on the project progress. [5 Marks) d)

Step by Step Solution

There are 3 Steps involved in it

1 Expert Approved Answer
Step: 1 Unlock blur-text-image
Question Has Been Solved by an Expert!

Get step-by-step solutions from verified subject matter experts

Step: 2 Unlock
Step: 3 Unlock

Students Have Also Explored These Related General Management Questions!