

Question: a) Using Table 1 draw a simple Gantt Chart for the project and indicate on the chart the current timeline. [2 Marks] b) Calculate the
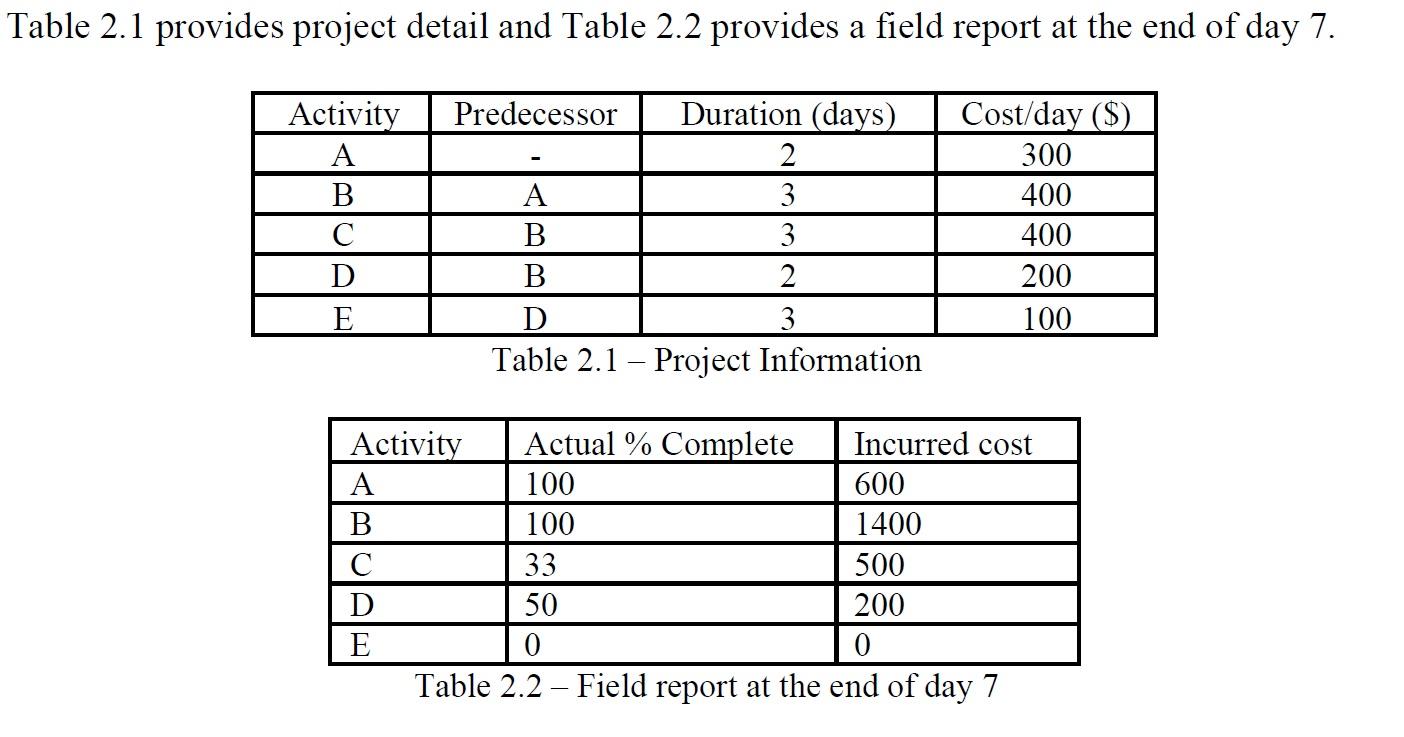 a) Using Table 1 draw a simple Gantt Chart for the project and indicate on the chart the current timeline. [2 Marks] b) Calculate the ACWP, BCWP, and BCWS for each of the activities. [5 Marks] c) Using the ACWP, BCWP and BCWS totals calculate the CPI, CV, SPI, and SV for the project. [8 Marks] d) By interpreting your calculated values for CPI, CV, SPI and SV provide and analysis on the project progress.
Step by Step Solution
There are 3 Steps involved in it
1 Expert Approved Answer
Step: 1 Unlock

Question Has Been Solved by an Expert!
Get step-by-step solutions from verified subject matter experts
Step: 2 Unlock
Step: 3 Unlock