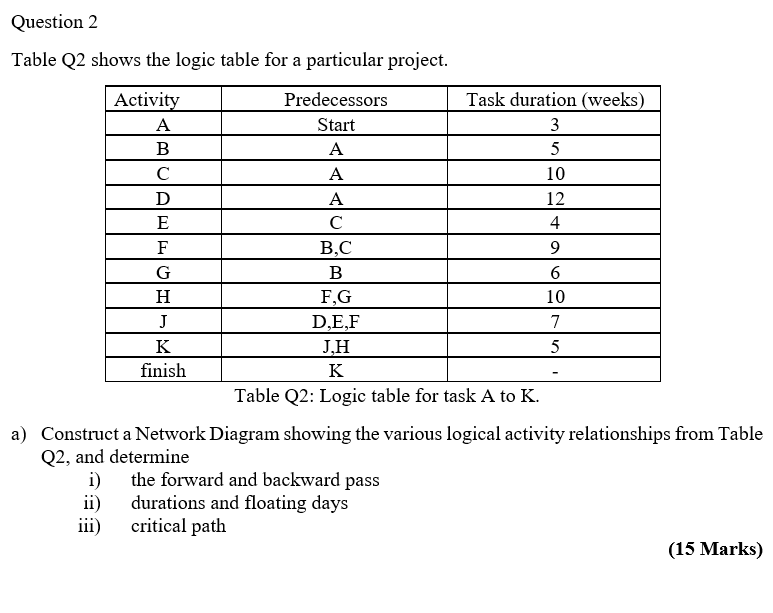
Question: Question 2 Table Q2 shows the logic table for a particular project. Activity Predecessors Task duration (weeks) A Start 3 B A 5 A 10

Question 2 Table Q2 shows the logic table for a

Question 2 Table Q2 shows the logic table for a particular project. Activity Predecessors Task duration (weeks) A Start 3 B A 5 A 10 D A 12 E 4 F B,C 9 G B 6 H F G 10 J D,E,F 7 K JH 5 finish Table Q2: Logic table for task A to K. a) Construct a Network Diagram showing the various logical activity relationships from Table Q2, and determine i) the forward and backward pass ii) durations and floating days iii) critical path (15 Marks) K

Step by Step Solution

There are 3 Steps involved in it

1 Expert Approved Answer
Step: 1 Unlock blur-text-image
Question Has Been Solved by an Expert!

Get step-by-step solutions from verified subject matter experts

Step: 2 Unlock
Step: 3 Unlock

Students Have Also Explored These Related General Management Questions!