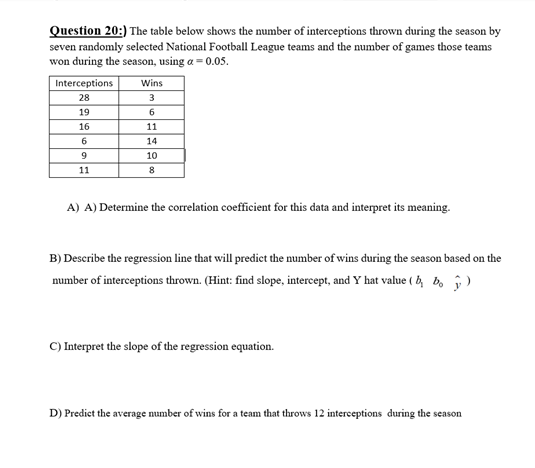
Question: Question 20:) The table below shows the number of interceptions thrown during the season by seven randomly selected National Football League teams and the number

Question 20:) The table below shows the number of

Question 20:) The table below shows the number of interceptions thrown during the season by seven randomly selected National Football League teams and the number of games those teams won during the season, using =0.05. A) A) Determine the correlation coefficient for this data and interpret its meaning. B) Describe the regression line that will predict the number of wins during the season based on the number of interceptions thrown. (Hint: find slope, intercept, and Y hat value (b1b0y^) C) Interpret the slope of the regression equation. D) Predict the average number of wins for a team that throws 12 interceptions during the season

Step by Step Solution

There are 3 Steps involved in it

1 Expert Approved Answer
Step: 1 Unlock blur-text-image
Question Has Been Solved by an Expert!

Get step-by-step solutions from verified subject matter experts

Step: 2 Unlock
Step: 3 Unlock

Students Have Also Explored These Related General Management Questions!