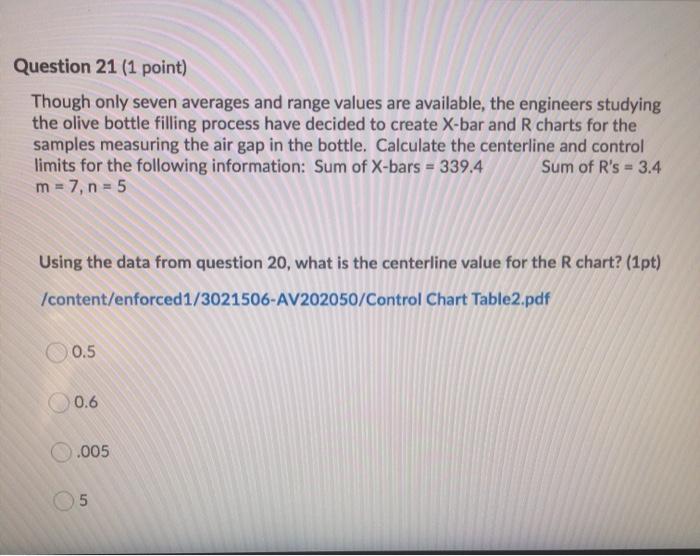
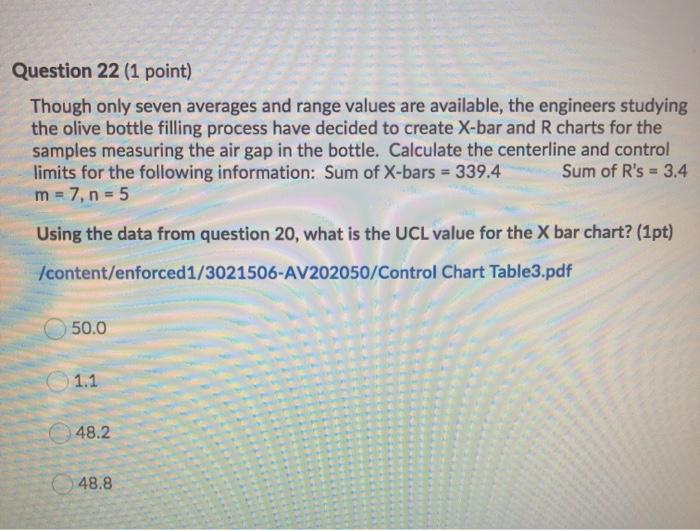
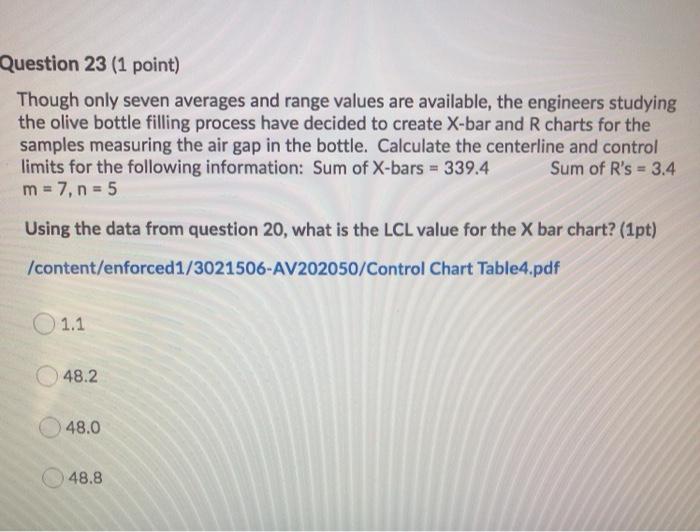
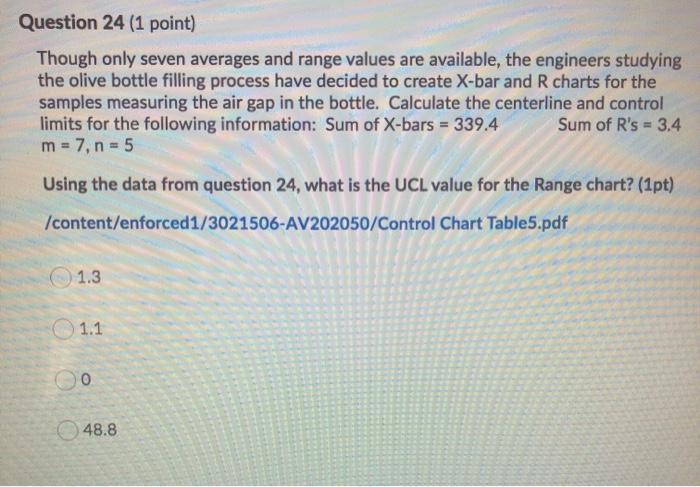
Question: Question 21 (1 point) Though only seven averages and range values are available, the engineers studying the olive bottle filling process have decided to create

Question 21 (1 point) Though only seven averages
Question 21 (1 point) Though only seven averages and range values are available, the engineers studying the olive bottle filling process have decided to create X-bar and R charts for the samples measuring the air gap in the bottle. Calculate the centerline and control limits for the following information: Sum of X-bars = 339.4 Sum of R's - 3.4 m = 7, n = 5 Using the data from question 20, what is the centerline value for the R chart? (1pt) /content/enforced1/3021506-AV202050/Control Chart Table2.pdf 0.5 0.6 0.005 5 Question 22 (1 point) Though only seven averages and range values are available, the engineers studying the olive bottle filling process have decided to create X-bar and R charts for the samples measuring the air gap in the bottle. Calculate the centerline and control limits for the following information: Sum of X-bars = 339.4 Sum of R's = 3.4 m = 7, n = 5 Using the data from question 20, what is the UCL value for the X bar chart? (1pt) /content/enforced1/3021506-AV202050/Control Chart Table3.pdf 50.0 1.1 48.2 48.8 Question 23 (1 point) Though only seven averages and range values are available, the engineers studying the olive bottle filling process have decided to create X-bar and R charts for the samples measuring the air gap in the bottle. Calculate the centerline and control limits for the following information: Sum of X-bars = 339.4 Sum of R's = 3.4 m = 7, n = 5 Using the data from question 20, what is the LCL value for the X bar chart? (1pt) /content/enforced1/3021506-AV202050/Control Chart Table4.pdf O 1.1 48.2 48.0 48.8 Question 24 (1 point) Though only seven averages and range values are available, the engineers studying the olive bottle filling process have decided to create X-bar and R charts for the samples measuring the air gap in the bottle. Calculate the centerline and control limits for the following information: Sum of X-bars = 339.4 Sum of R's = 3.4 m = 7, n = 5 Using the data from question 24, what is the UCL value for the Range chart? (1pt) /content/enforced1/3021506-AV202050/Control Chart Table5.pdf 1.3 1.1 00 48.8

Step by Step Solution

There are 3 Steps involved in it

1 Expert Approved Answer
Step: 1 Unlock blur-text-image
Question Has Been Solved by an Expert!

Get step-by-step solutions from verified subject matter experts

Step: 2 Unlock
Step: 3 Unlock

Students Have Also Explored These Related General Management Questions!