

Question: Question 3 A packaging machine at the Sunshine Fruit Company fills boxes with raisins. The labeled weight of the boxes is 9 ounces. The quality'
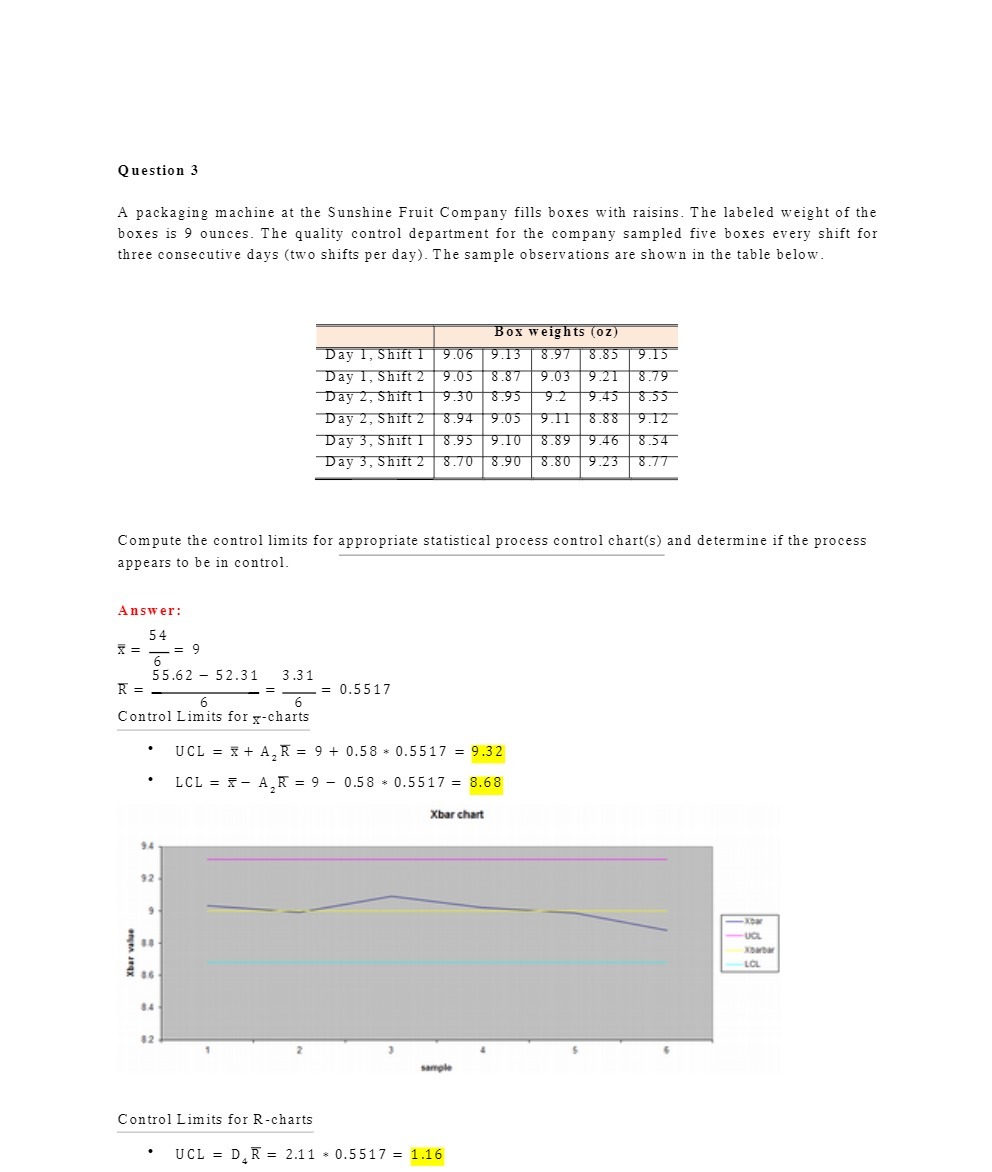
Question 3 A packaging machine at the Sunshine Fruit Company fills boxes with raisins. The labeled weight of the boxes is 9 ounces. The quality' control department for the company sampled five boxes every shift for three consecutive days [two shifts per day). The sample observations are shown in the table below. Compute the control limits for appropriate statistical process control chart(s) and determine if the process appears to be in control. Answer: 54 E: _= 9 6 55.62 52.31 3.31 E = = = 0.5517 5 6 Control Limits for g-charts ' UCL = 2+ A2E= 9 + 0.58: 0.551? = 9.32 ' LCL = f AER- = 9 0.58 * 0.551? = 8.68 Control Limits for Rcharts ' UCL = Dull: 2.11 \"0.551? = 1.16
Step by Step Solution
There are 3 Steps involved in it

Get step-by-step solutions from verified subject matter experts