

Question: question 3. for the given sample size 1 upper control limit (UCL-x 2 lower comtrol limit (LCL-x The control limits for the 3-sigma R charts
question 3.
for the given sample size
1 upper control limit (UCL-x
2 lower comtrol limit (LCL-x
The control limits for the 3-sigma R charts
1 upper control limit (UCL R
2 lower comtrol limit (LCL R 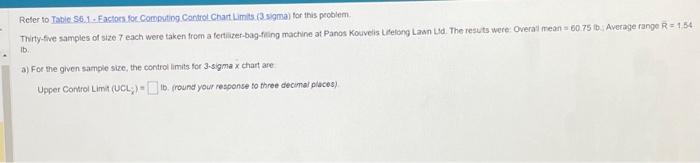
Reter to Tabie S6.1 - Eactoes foc Computiog. Controt Chart Limits i3 syma) for this problem: Thity-tive samples of size 7 each were taken from a fertichetbag-filing machine at Panos Kouveis tielong Lasn Ld. The resuts were: Overa: mean = 60.75 ib. Average range R=1.54 ib. a) For the given sample size, the control limits for 3 -sigma x thant are Upper Control Limi (UCL-) = 10. rround your response to three decimal places)
Step by Step Solution
There are 3 Steps involved in it
1 Expert Approved Answer
Step: 1 Unlock

Question Has Been Solved by an Expert!
Get step-by-step solutions from verified subject matter experts
Step: 2 Unlock
Step: 3 Unlock