

Question: Question 3, Part (A) 0.0 / 3.0() Consider two stocks, A and B. Expected returns on these stocks are: TA 10.79%, TB = 13.80%.
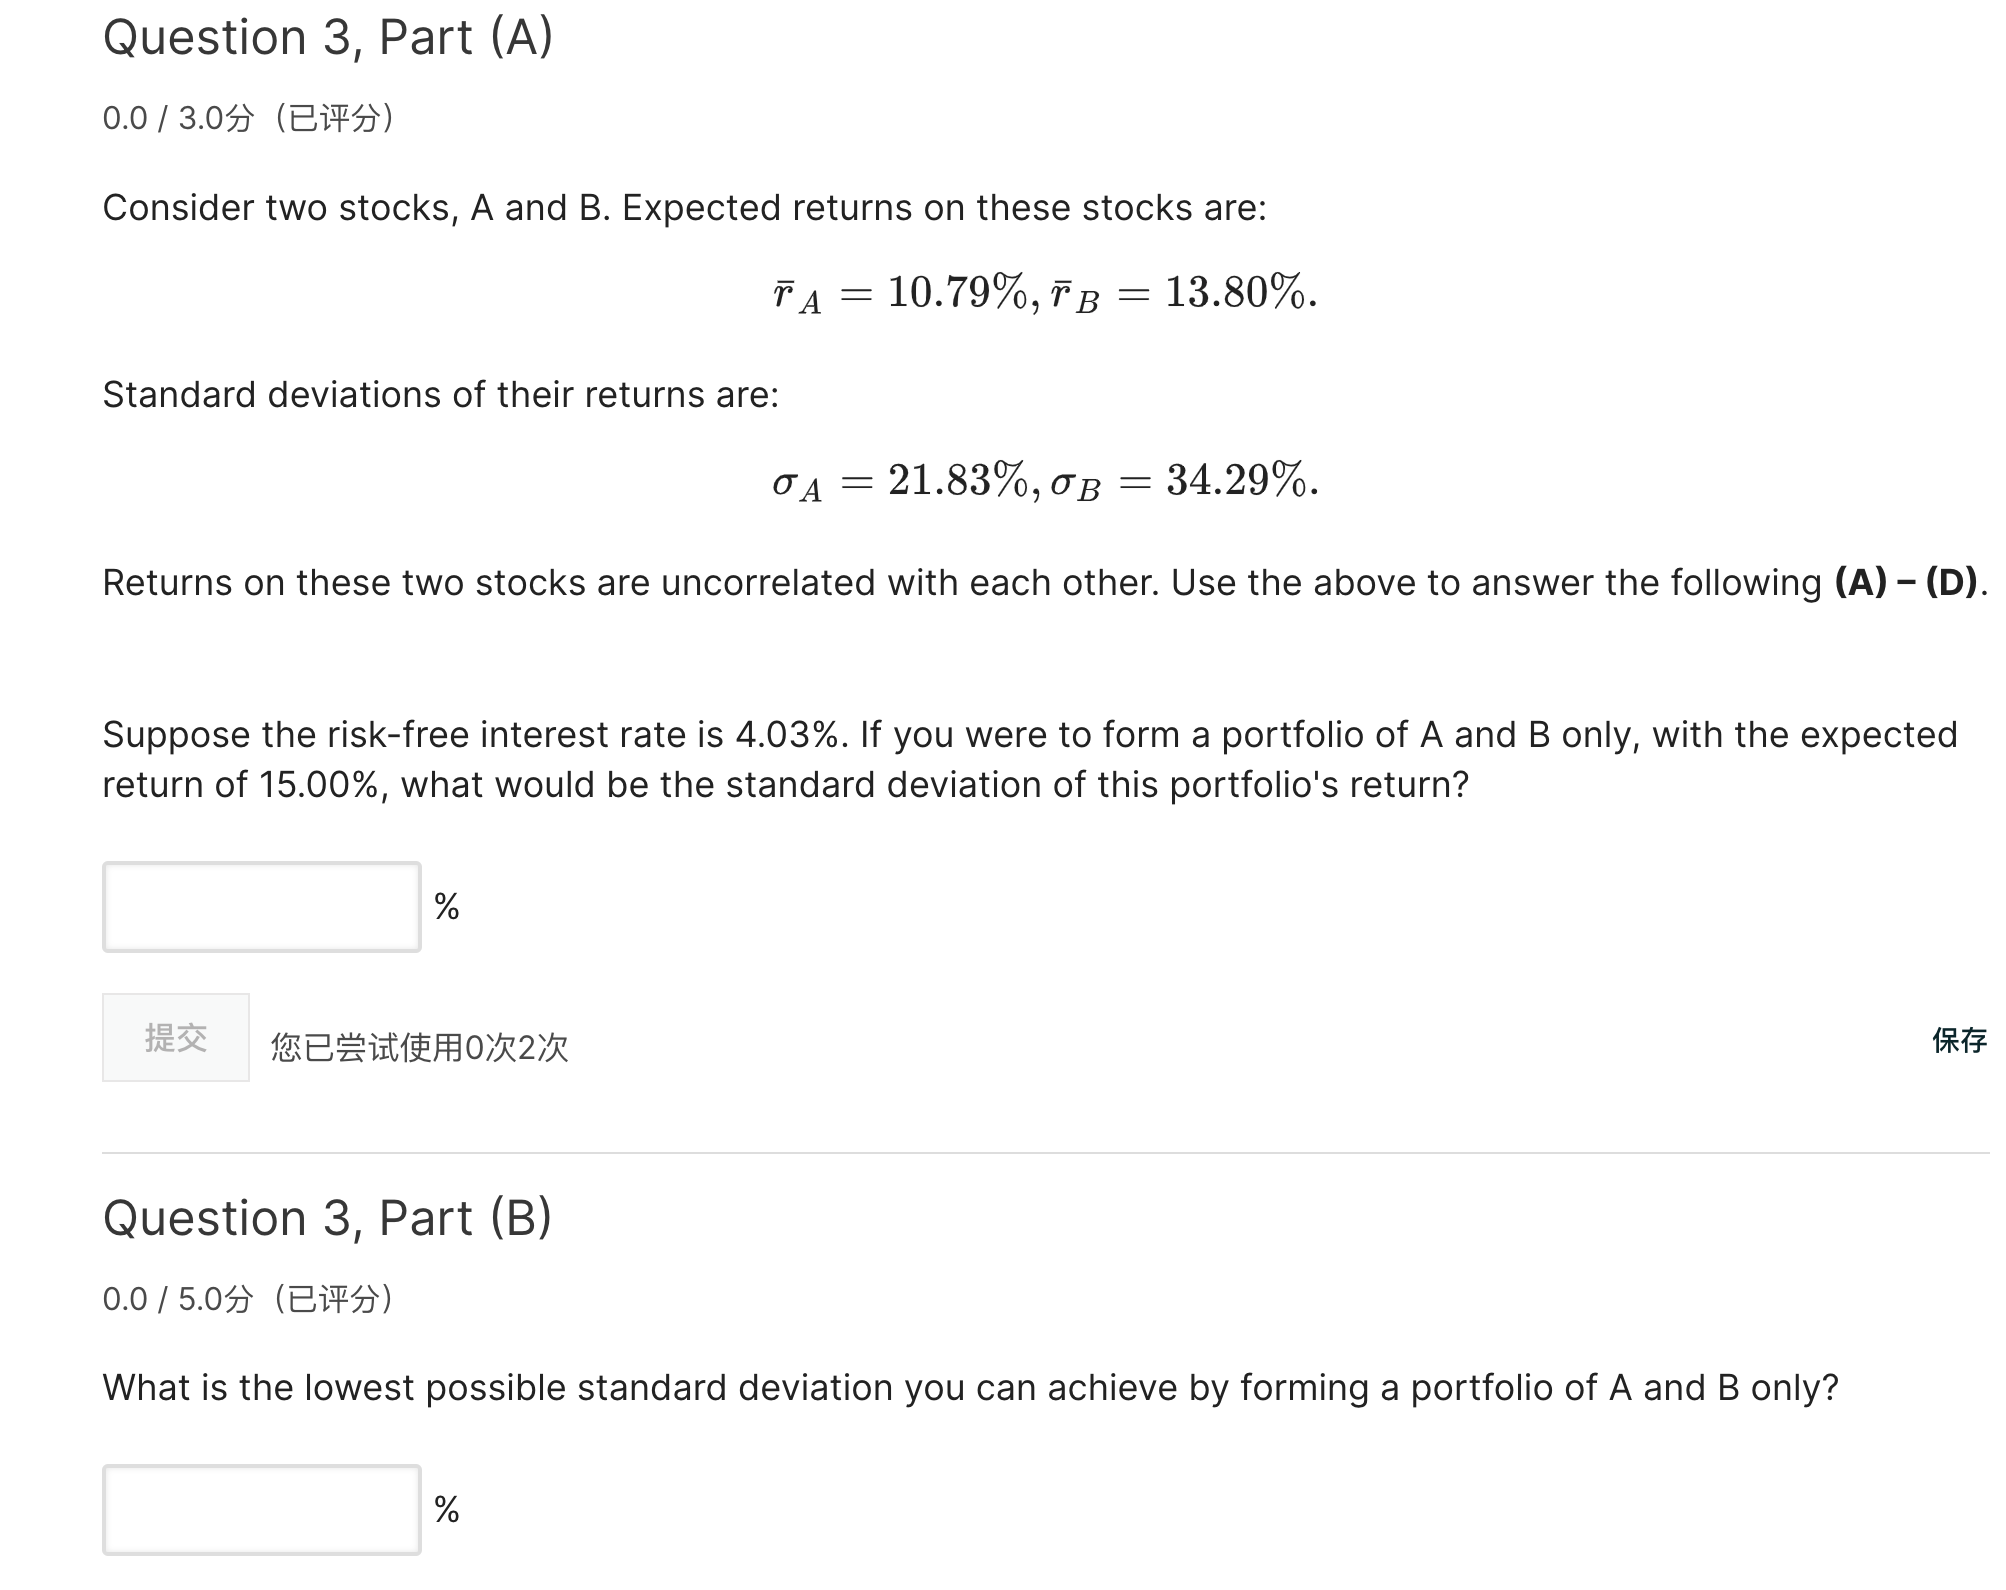
Question 3, Part (A) 0.0 / 3.0() Consider two stocks, A and B. Expected returns on these stocks are: TA 10.79%, TB = 13.80%. = Standard deviations of their returns are: A = 21.83%, B = 34.29%. Returns on these two stocks are uncorrelated with each other. Use the above to answer the following (A) - (D). Suppose the risk-free interest rate is 4.03%. If you were to form a portfolio of A and B only, with the expected return of 15.00%, what would be the standard deviation of this portfolio's return? % 02 Question 3, Part (B) 0.0 / 5.0() What is the lowest possible standard deviation you can achieve by forming a portfolio of A and B only? % 1717
Step by Step Solution
There are 3 Steps involved in it

Get step-by-step solutions from verified subject matter experts