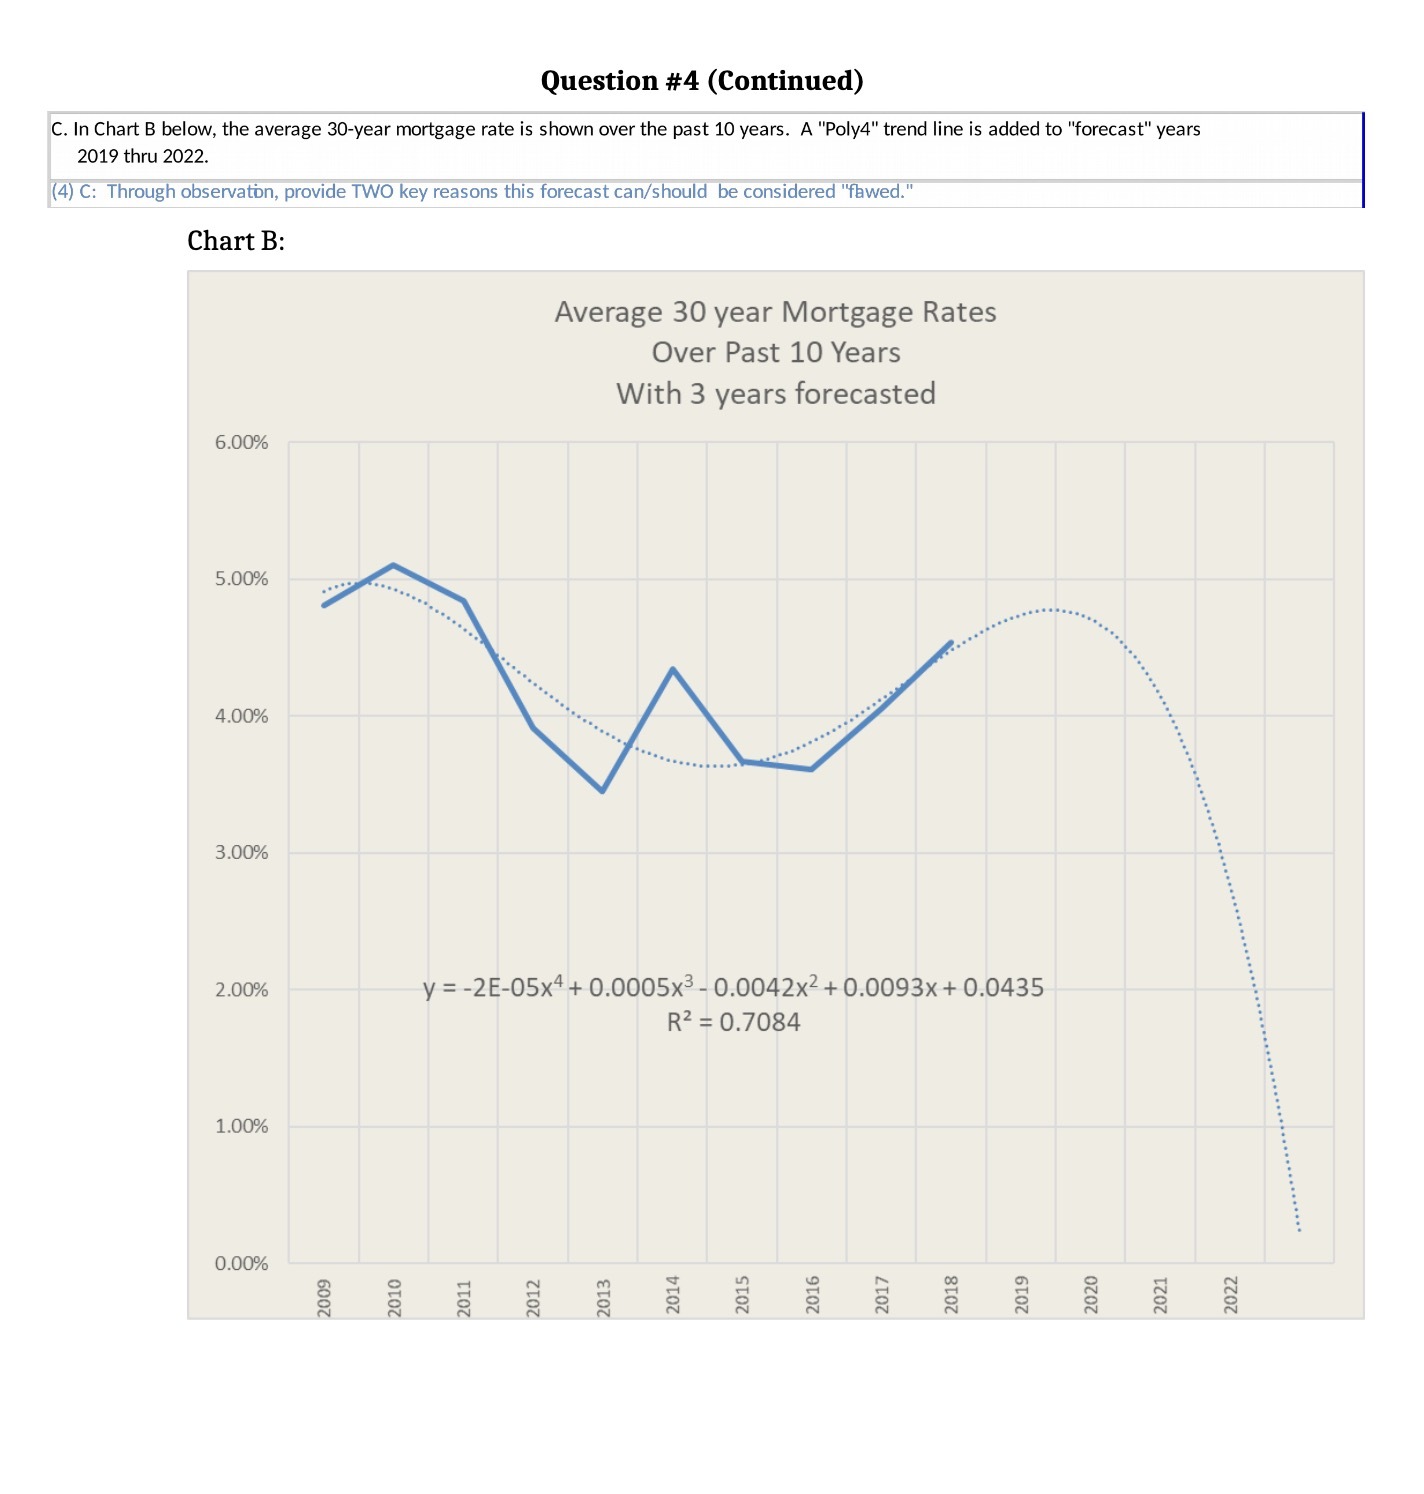
Question: Question #4 (Continued) C. In Chart B below, the average 30-year mortgage rate is shown over the past 10 years. A Poly4 trend line is

Question #4 (Continued) C. In Chart B below, the
Question #4 (Continued) C. In Chart B below, the average 30-year mortgage rate is shown over the past 10 years. A "Poly4" trend line is added to "forecast" years 2019 thru 2022. (4) C: Through observation, provide TWO key reasons this forecast can/should be considered "flawed." Chart B: Average 30 year Mortgage Rates Over Past 10 Years With 3 years forecasted 6.00% 5.00% 4.00% ....... 3.00% 2.00% y = -2E-05x4 + 0.0005x3 - 0.0042x2 + 0.0093x + 0.0435 R2 = 0.7084 1.00% . . .............". 0.00% 2014 2017 2020 2022 2009 2011 2018 2019 2010 2012 2016 2021 2013 2015

Step by Step Solution

There are 3 Steps involved in it

1 Expert Approved Answer
Step: 1 Unlock blur-text-image
Question Has Been Solved by an Expert!

Get step-by-step solutions from verified subject matter experts

Step: 2 Unlock
Step: 3 Unlock

Students Have Also Explored These Related Finance Questions!