

Question: Question #4 (Continued) C. In Chart B below, the average 30-year mortgage rate over the last 10 years are shown. A Linear trend line is
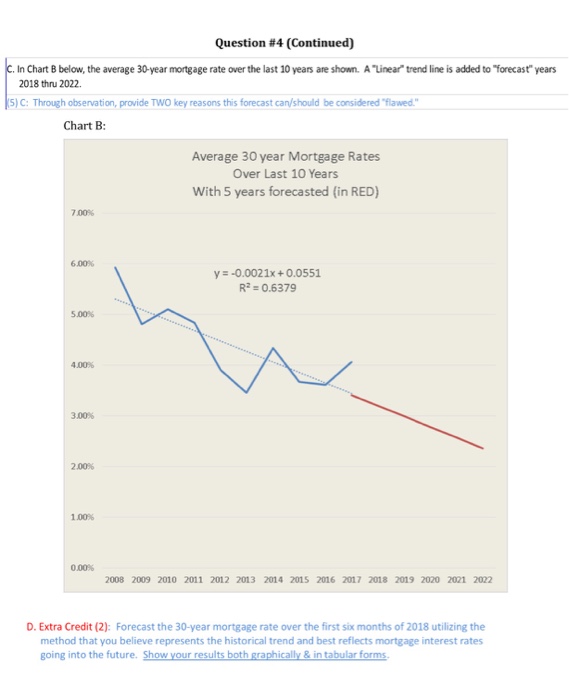
Question #4 (Continued) C. In Chart B below, the average 30-year mortgage rate over the last 10 years are shown. A Linear trend line is added to "forecast years 2018 thru 2022. 5) C: Through observation, provide TWO key reasons this forecast can/should be considered "flawed. Chart B: Average 30 year Mortgage Rates Over Last 10 Years With 5 years forecasted (in RED) 6.00% y -0.0021x+0.0551 R2-0.6379 5.00% 4,00% 300% 2.00% 100% 0.00% 2008 2009 2010 2011 2012 2013 2014 2015 2016 2017 2018 2019 2020 2021 2022 D. Extra Credit (2): Forecast the 30-year mortgage rate over the first six months of 2018 utilizing the method that you believe represents the historical trend and best reflects mortgage interest rates going into the future. Show your results both graphically & in tabular forms
Step by Step Solution
There are 3 Steps involved in it

Get step-by-step solutions from verified subject matter experts