

Question: Question #4 (Continued) C. In Chart below, the average 30-year mortgage rate is shown over the past 10 years. A Poly4 trend line is added
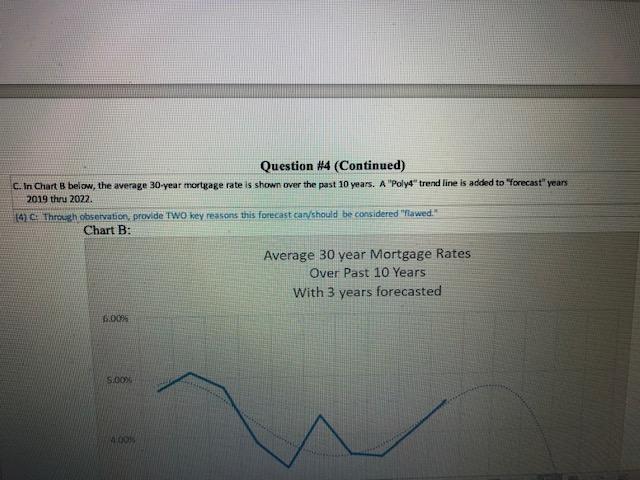
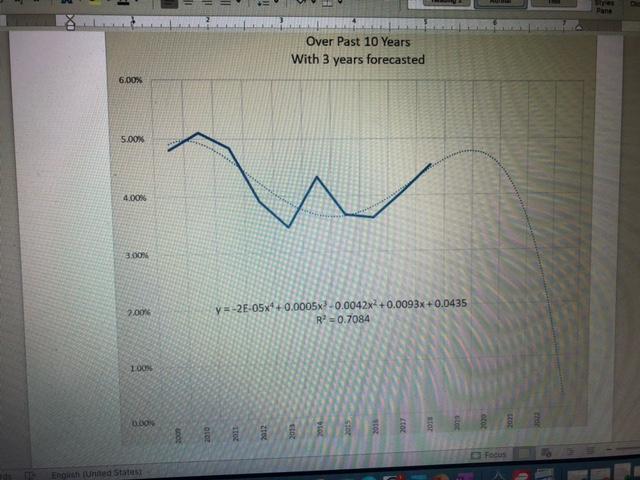
Question #4 (Continued) C. In Chart below, the average 30-year mortgage rate is shown over the past 10 years. A "Poly4" trend line is added to "Forecast years 2019 thru 2022. 14) C: Through observation provide TWO key reasons this forecast can should be considered "Piawed. Chart B: Average 30 year Mortgage Rates Over Past 10 Years With 3 years forecasted 6.00% S.00% 400 re Over Past 10 Years With 3 years forecasted 6.00% 5.OON 4.00 BOON 2009 y=-2E-05x4 +0.0005 -0.0042x2 +0.0093x +0.0435 R-0.7084 100% DON En unted States Question #4 (Continued) C. In Chart below, the average 30-year mortgage rate is shown over the past 10 years. A "Poly4" trend line is added to "Forecast years 2019 thru 2022. 14) C: Through observation provide TWO key reasons this forecast can should be considered "Piawed. Chart B: Average 30 year Mortgage Rates Over Past 10 Years With 3 years forecasted 6.00% S.00% 400 re Over Past 10 Years With 3 years forecasted 6.00% 5.OON 4.00 BOON 2009 y=-2E-05x4 +0.0005 -0.0042x2 +0.0093x +0.0435 R-0.7084 100% DON En unted States
Step by Step Solution
There are 3 Steps involved in it

Get step-by-step solutions from verified subject matter experts