

Question: Question #4 Forecasting Question #4 Below is the average 30-year mortgage rate over the last 45 years, as graphically shown in Chart A below. In
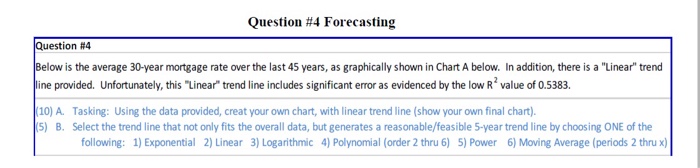
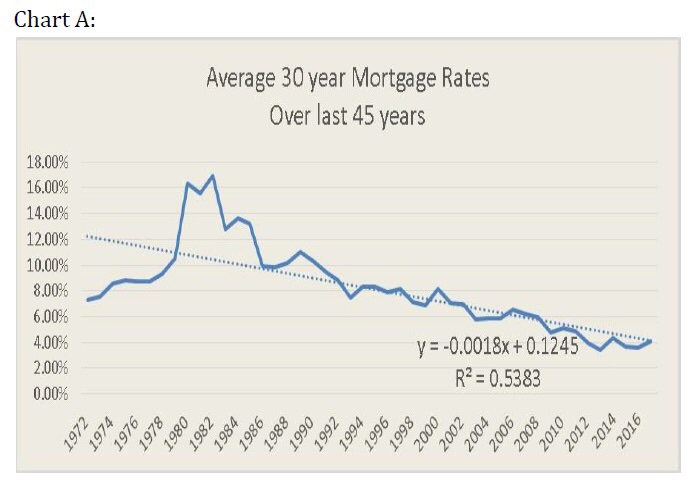
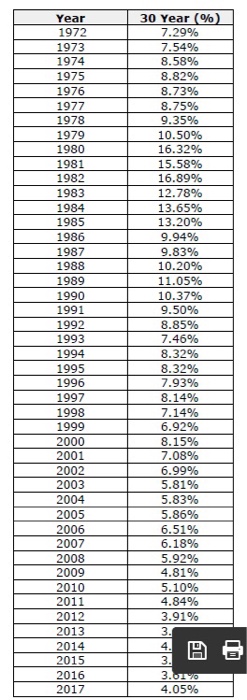
Question #4 Forecasting Question #4 Below is the average 30-year mortgage rate over the last 45 years, as graphically shown in Chart A below. In addition, there is a "Linear" trend ine provided. Unfortunately, this "Linear" trend line includes significant error as evidenced by the low R value of 0.5383. 10) A. Tasking: Using the data provided, creat your own chart, with linear trend line (show your own final chart). 5) B. Select the trend line that not only fits the overall data, but generates a reasonable/feasible 5-year trend line by choosing ONE of the following: 1) Exponential 2) Linear 3) Logarithmic 4) Polynomial (order 2 thru 6) 5) Power 6) Moving Average (periods 2 thru x)
Step by Step Solution
There are 3 Steps involved in it

Get step-by-step solutions from verified subject matter experts