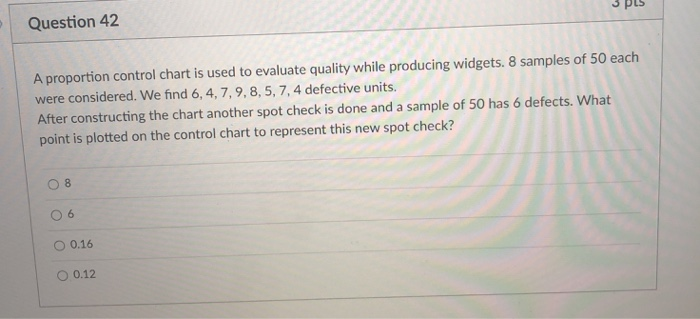
Question: Question 42 A proportion control chart is used to evaluate quality while producing widgets. 8 samples of 50 each were considered. We find 6,4,7,9, 8,

Question 42 A proportion control chart is used to
Question 42 A proportion control chart is used to evaluate quality while producing widgets. 8 samples of 50 each were considered. We find 6,4,7,9, 8, 5, 7,4 defective units. After constructing the chart another spot check is done and a sample of 50 has 6 defects. What point is plotted on the control chart to represent this new spot check? 8 6 0.16 O 0.12

Step by Step Solution

There are 3 Steps involved in it

1 Expert Approved Answer
Step: 1 Unlock blur-text-image
Question Has Been Solved by an Expert!

Get step-by-step solutions from verified subject matter experts

Step: 2 Unlock
Step: 3 Unlock

Students Have Also Explored These Related General Management Questions!