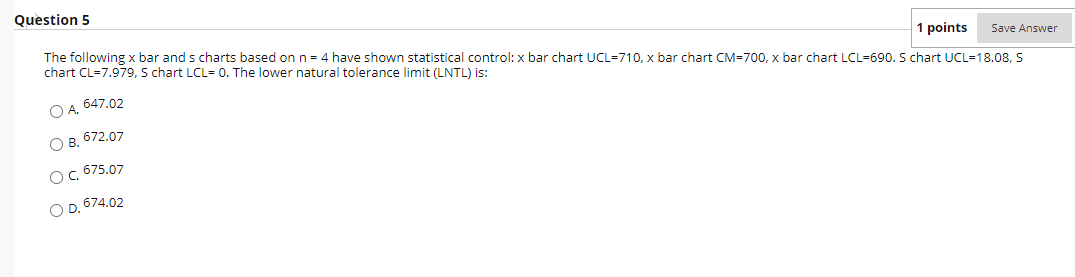
Question: Question 5 1 points Save Answer The following x bar and s charts based on n = 4 have shown statistical control: x bar chart

Question 5 1 points Save Answer The following x

Question 5 1 points Save Answer The following x bar and s charts based on n = 4 have shown statistical control: x bar chart UCL-710, x bar chart CM-700, x bar chart LCL=690.5 chart UCL=18.08, 5 chart CL=7.979, S chart LCL= 0. The lower natural tolerance limit (LNTL) is: O A 647.02 OB. 672.07 OC. 675.07 OD. 674.02

Step by Step Solution

There are 3 Steps involved in it

1 Expert Approved Answer
Step: 1 Unlock blur-text-image
Question Has Been Solved by an Expert!

Get step-by-step solutions from verified subject matter experts

Step: 2 Unlock
Step: 3 Unlock

Students Have Also Explored These Related General Management Questions!