

Question: Question 5. (24 marks) Suppose that there are only two risky assets (stocks) A and B in the market. Statistics for stocks A and
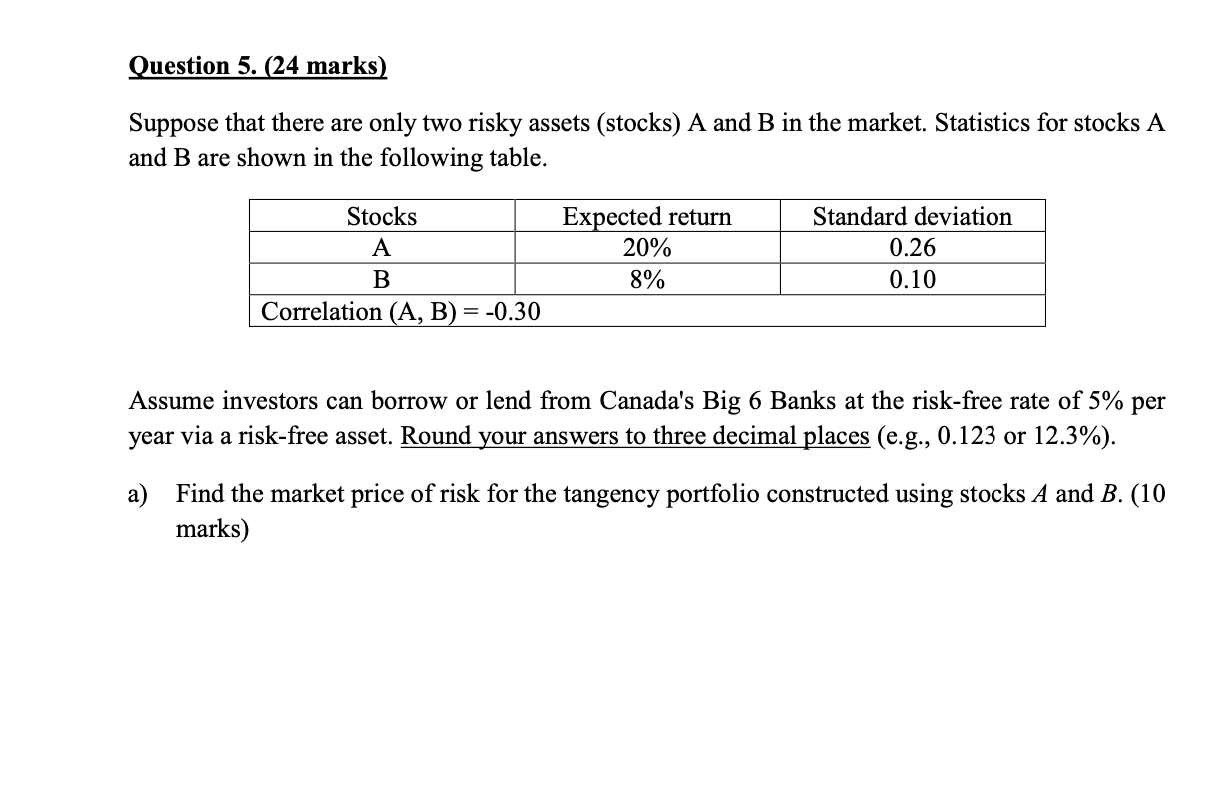
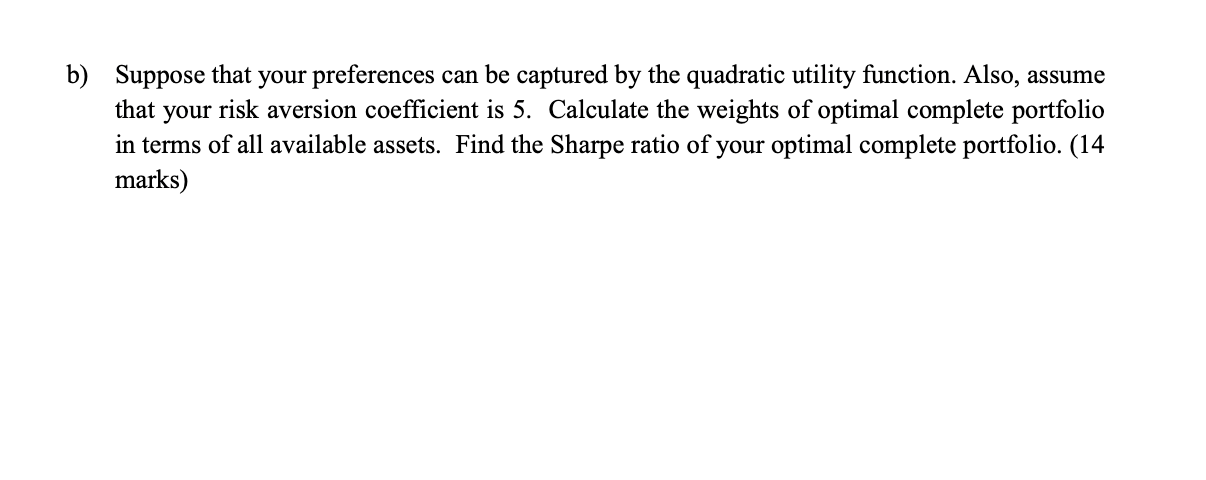
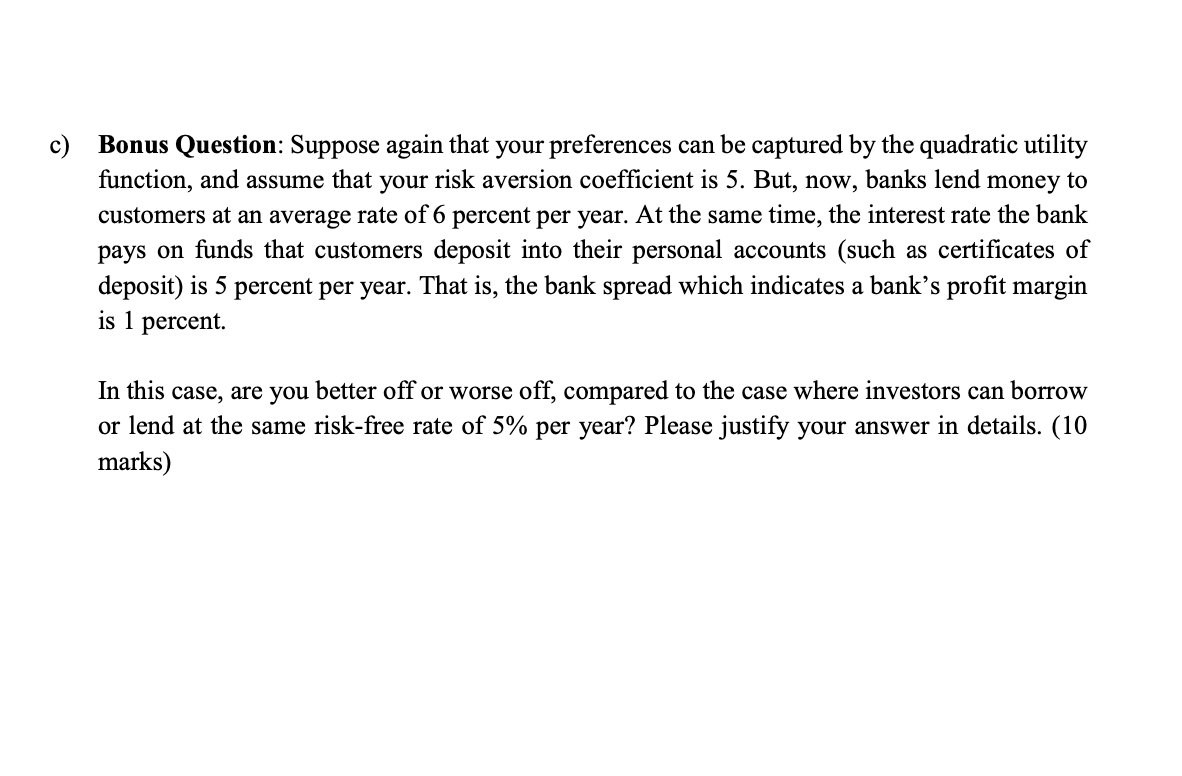
Question 5. (24 marks) Suppose that there are only two risky assets (stocks) A and B in the market. Statistics for stocks A and B are shown in the following table. Stocks A Expected return 20% Standard deviation 0.26 B 8% 0.10 Correlation (A, B) = -0.30 Assume investors can borrow or lend from Canada's Big 6 Banks at the risk-free rate of 5% per year via a risk-free asset. Round your answers to three decimal places (e.g., 0.123 or 12.3%). a) Find the market price of risk for the tangency portfolio constructed using stocks A and B. (10 marks) b) Suppose that your preferences can be captured by the quadratic utility function. Also, assume that your risk aversion coefficient is 5. Calculate the weights of optimal complete portfolio in terms of all available assets. Find the Sharpe ratio of your optimal complete portfolio. (14 marks) c) Bonus Question: Suppose again that your preferences can be captured by the quadratic utility function, and assume that your risk aversion coefficient is 5. But, now, banks lend money to customers at an average rate of 6 percent per year. At the same time, the interest rate the bank pays on funds that customers deposit into their personal accounts (such as certificates of deposit) is 5 percent per year. That is, the bank spread which indicates a bank's profit margin is 1 percent. In this case, are you better off or worse off, compared to the case where investors can borrow or lend at the same risk-free rate of 5% per year? Please justify your answer in details. (10 marks)
Step by Step Solution
There are 3 Steps involved in it
lets break down this portfolio optimization problem step by step Given Data Answer A Stock A ERA 20 020 A 026 Stock B ERB 8 008 B 010 Correlation AB AB 030 RiskFree Rate Rf 5 005 Risk Aversion Coeffic... View full answer

Get step-by-step solutions from verified subject matter experts