

Question: QUESTION 9 import matplotlib.pyplot as plt import numpy as np x1=-39 y1=48 x2=50 y2=-50 x_values=[x1,x2] y_values=[y1,y2] plt.plot(x_values,y_values) plt.show() how do i get matplotlib.pyplot and numpy
 QUESTION 9
import matplotlib.pyplot as plt import numpy as np x1=-39 y1=48 x2=50 y2=-50 x_values=[x1,x2] y_values=[y1,y2] plt.plot(x_values,y_values) plt.show()
how do i get matplotlib.pyplot and numpy
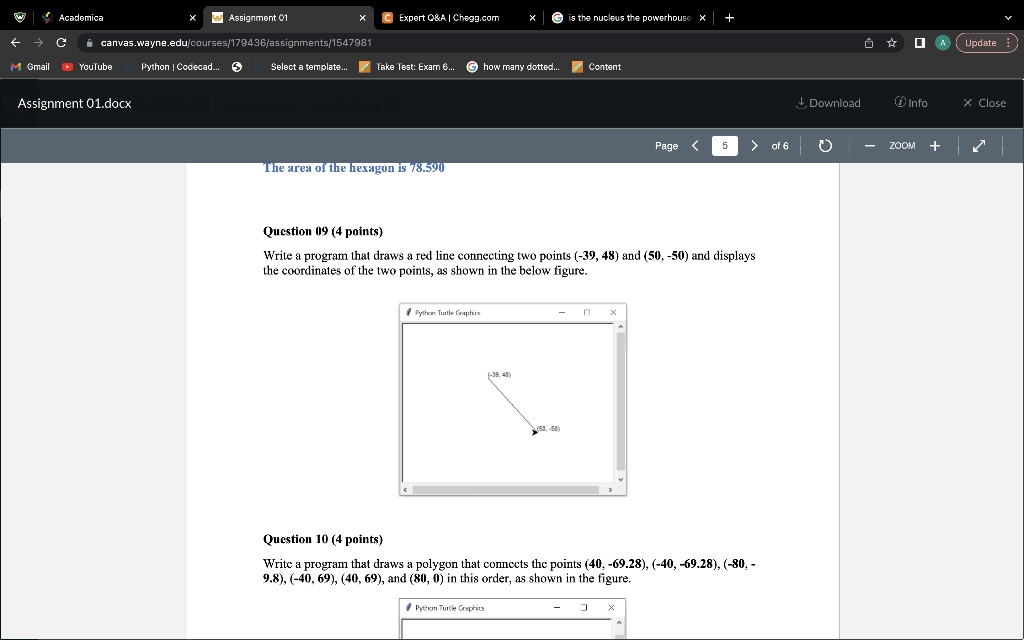
Question (19 (4 points) Write a program that draws a red line connecting two points (39,48) and (50,50) and displays the coordinates of the two points, as shown in the below figure. Question 10 (4 points) Write a program that draws a polygon that connects the points (40,69.28),(40,69.28),(80, 9.8),(40,69),(40,69), and (80,0) in this order, as shown in the figure
Step by Step Solution
There are 3 Steps involved in it
1 Expert Approved Answer
Step: 1 Unlock

Question Has Been Solved by an Expert!
Get step-by-step solutions from verified subject matter experts
Step: 2 Unlock
Step: 3 Unlock