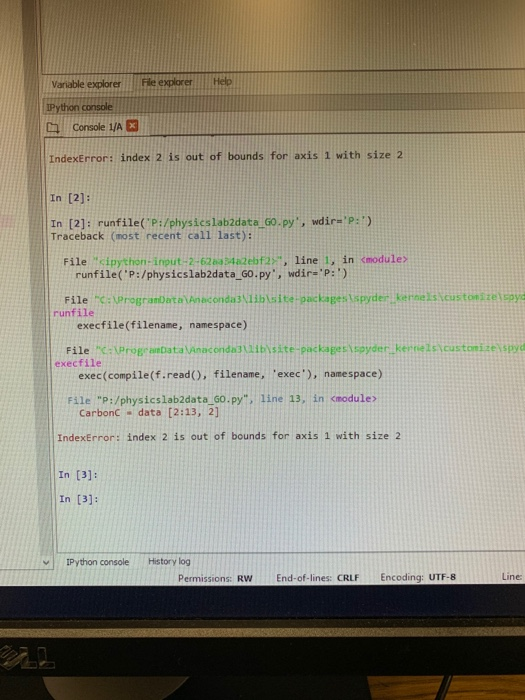
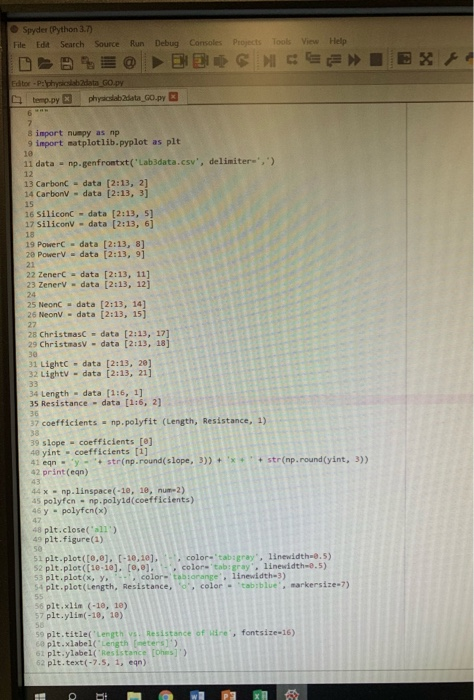
Question: i'm trying to plot a graph usinf phyton, but j keep getting this error (2nd picture): IndexError: index 2 out of bounds for axis 1
i'm trying to plot a graph usinf phyton, but j keep getting this error (2nd picture):
IndexError: index 2 out of bounds for axis 1 with size 2
Projects Tools Spyder (Python 3.7 File Edit Search Source Run Debug Consoles @BB Editor - P:"physicslabdata GO.py temp.py physicslabdata Go.py View Help EE DE 8 import numpy as np 9 import matplotlib.pyplot as plt 11 data - np-genfrontxt('Lab3data.csv', delimiters',') 12 13 Carbonc data 12:13, 21 14 CarbonV - data [2:13, 3] 16 Silicon - data 2:13, 51 17 Siliconv - data 12:13, 61 19 Power - data (2:13, 8] 20 PowerV = data [2:13, 9] 22 Zener - data [2:13, 11] 23 Zenerv - data [2:13, 12] 25 Neon - data [2:13, 14] 26 Neon V - data (2:13, 15) 28 Christmas = data (2:13, 17] 29 Christmas - data [2:13, 181 31 LightC - data [2:13, 20) 32 Light - data (2:13, 21] 34 Length - data (116, 1] 35 Resistance - data [1:6, 2] 37 coefficients - np.polyfit (Length, Resistance, 1) 39 slope - coefficients rel 40 yint - coefficients [1] 41 egn-'y- str(np.round(slope, 3)) + 'x+ + str(np.round(yint, 3)) 42.print(en) 44 X = np.linspace(-10, 10, num.2) 45 polyfon - np.polyid(coefficients) 46 y - polyfon(x) 48 plt.close('all') 49 plt. figure(1) 51 plt.plot([0,0], [-10,10), color-'tab:gray", linewidth=0.5) 52 plt.plot([10.10), (0,0), color-'tab gray, linewidth=0.5) 53 plt.plot(x, y , color taborange, linewidth-3) 54 plt.plot(Length, Resistance, 'o'color - tabiblue, markersize-7) 56 plt.xlin (-10, 10) 57 plt. ylim-10, 10) 59 plt.title('Length vs. Resistance of wire, font size=16) plt.xlabel('Length [meters) 62 plt.ylabel('Resistance (Ohes]') 52 plt.text(-7.5, 1, egn) FOI Variable explorer File explorer Console 1/A X IndexError: index 2 is out of bounds for axis 1 with size 2 In [2]: In [2] : runfile("P:/physicslab2data_60.py", wdir='P:') Traceback (most recent call last): File "cipython-input-2-62 2 ebf2 , line 1, in runfile('P:/physicslab2data_GO.py", wdir='P:') File Programata Anaconda3\liblite-packages spyder kernels customizelspyd runfile execfile(filename, namespace) File "C:\ProgramData Anaconda3libsite-packages isoyder kennis customize spyd execfile exec(compile(f.read(), filename, 'exec'), namespace) File "P:/physicslab2data_GO.py", line 13, in CarbonC - data [2:13, 2] IndexError: index 2 is out of bounds for axis 1 with size 2 In [3]: In [3]: IPython console History log Permissions: RW End-of-lines: CRLF Encoding: UTF-8 Line Projects Tools Spyder (Python 3.7 File Edit Search Source Run Debug Consoles @BB Editor - P:"physicslabdata GO.py temp.py physicslabdata Go.py View Help EE DE 8 import numpy as np 9 import matplotlib.pyplot as plt 11 data - np-genfrontxt('Lab3data.csv', delimiters',') 12 13 Carbonc data 12:13, 21 14 CarbonV - data [2:13, 3] 16 Silicon - data 2:13, 51 17 Siliconv - data 12:13, 61 19 Power - data (2:13, 8] 20 PowerV = data [2:13, 9] 22 Zener - data [2:13, 11] 23 Zenerv - data [2:13, 12] 25 Neon - data [2:13, 14] 26 Neon V - data (2:13, 15) 28 Christmas = data (2:13, 17] 29 Christmas - data [2:13, 181 31 LightC - data [2:13, 20) 32 Light - data (2:13, 21] 34 Length - data (116, 1] 35 Resistance - data [1:6, 2] 37 coefficients - np.polyfit (Length, Resistance, 1) 39 slope - coefficients rel 40 yint - coefficients [1] 41 egn-'y- str(np.round(slope, 3)) + 'x+ + str(np.round(yint, 3)) 42.print(en) 44 X = np.linspace(-10, 10, num.2) 45 polyfon - np.polyid(coefficients) 46 y - polyfon(x) 48 plt.close('all') 49 plt. figure(1) 51 plt.plot([0,0], [-10,10), color-'tab:gray", linewidth=0.5) 52 plt.plot([10.10), (0,0), color-'tab gray, linewidth=0.5) 53 plt.plot(x, y , color taborange, linewidth-3) 54 plt.plot(Length, Resistance, 'o'color - tabiblue, markersize-7) 56 plt.xlin (-10, 10) 57 plt. ylim-10, 10) 59 plt.title('Length vs. Resistance of wire, font size=16) plt.xlabel('Length [meters) 62 plt.ylabel('Resistance (Ohes]') 52 plt.text(-7.5, 1, egn) FOI Variable explorer File explorer Console 1/A X IndexError: index 2 is out of bounds for axis 1 with size 2 In [2]: In [2] : runfile("P:/physicslab2data_60.py", wdir='P:') Traceback (most recent call last): File "cipython-input-2-62 2 ebf2 , line 1, in runfile('P:/physicslab2data_GO.py", wdir='P:') File Programata Anaconda3\liblite-packages spyder kernels customizelspyd runfile execfile(filename, namespace) File "C:\ProgramData Anaconda3libsite-packages isoyder kennis customize spyd execfile exec(compile(f.read(), filename, 'exec'), namespace) File "P:/physicslab2data_GO.py", line 13, in CarbonC - data [2:13, 2] IndexError: index 2 is out of bounds for axis 1 with size 2 In [3]: In [3]: IPython console History log Permissions: RW End-of-lines: CRLF Encoding: UTF-8 Line