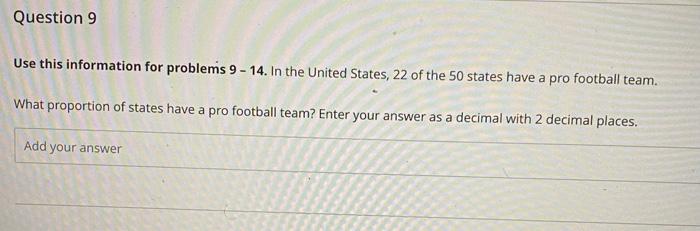
Question: Question 9 Use this information for problems 9-14. In the United States, 22 of the 50 states have a pro football team. What proportion of

Question 9 Use this information for problems
Question 9 Use this information for problems 9-14. In the United States, 22 of the 50 states have a pro football team. What proportion of states have a pro football team? Enter your answer as a decimal with 2 decimal places. Add your answer Question 10 Suppose we take a simple random sample of 20 states and calculate the sample proportion of these states that have a pro football team. What is the shape of the sampling distribution for this sample proportion? How do you know? A The sample proportion is normally distributed because the original population of states is normally distributed B The shape of the sampling distribution depends on which state we pick. The sample proportion is normally distributed because np 8.8 and n(1.p)-11.2 are both larger than 5. We do not know the shape of the sampling distribution without actually collecting samples. Question 11 What is the mean of the sampling distribution for this sample proportion? Enter your answer as a decimal with 2 decimal places. Add your answer Question 12 What is the standard deviation of the sampling distribution for this sample proportion? Round to 4 decimal places. Add your answer Question 13 Calculate Pl> 0.4) for the 20 randomly selected states. Round your answer to 4 decimal places. Add your answer Question 14 What the probability that between 40% and 50% of the 20 randomly selected states will have a pro football team? Round your answer to 4 decimal places. Add your answer Question 15 How does sample size affect the standard deviation of a sampling distribution? A A larger sample size leads to a smaller standard deviation (i.e. - better estimates). B A larger sample size leads to a smaller standard deviation (i.e. - worse estimates). A larger sample size leads to a larger standard deviation (i.e. - better estimates). A larger sample size leads to a larger standard deviation (i.e. - worse estimates)

Step by Step Solution

There are 3 Steps involved in it

1 Expert Approved Answer
Step: 1 Unlock blur-text-image
Question Has Been Solved by an Expert!

Get step-by-step solutions from verified subject matter experts

Step: 2 Unlock
Step: 3 Unlock

Students Have Also Explored These Related General Management Questions!