

Question: Question: Considering both the probability value and effect size measure, what interpretations would you make about the findings? That is, what are your conclusions about
Question:
Considering both the probability value and effect size measure, what interpretations would you make about the findings? That is, what are your conclusions about the effects of leaving happy faces on checks?
Recall again that Rind & Bordia (1996) investigated whether or not drawing a happy face on customers' checks increased the amount of tips received by a waitress at an upscale restaurant on a universitycampus. Duringthelunchhourawaitressdrewahappy,smilingfaceonthechecksofa randomhalfofhercustomers. Theremaininghalfofthecustomersreceivedacheckwithnodrawing(18 points).
The tip percentages for the control group (no happy face) are as follows:
45% 39% 36% 34% 34% 33% 31% 31% 30% 30% 28% 28% 28% 27% 27% 25% 23% 22% 21% 21% 20% 18% 8%
The tip percentages for the experimental group (happy face) are as follows:
72% 65% 47% 44% 41% 40% 34% 33% 33% 30% 29% 28% 27% 27% 25% 24% 24% 23% 22% 21% 21% 17%
Group of answer choices
The p value that is calculated for the t-test is dependent on several factors including sample size and effect size. It is very likely that, given the effect size obtained, if the sample size was larger the study would have yielded statistically significant results. Therefore, it appears that the low statistical power (i.e., high Type II error) of the study resulting from the small sample size was probably mainly responsible for the lack of significant findings.
The p value that is calculated for the t-test is dependent on one factor: sample size. It is very likely that, given the large effect size obtained, if the sample size was larger the study would have yielded statistically significant results. Therefore, it appears that the strong statistical power of the study resulting from the small sample size was mainly responsible for the lack of significant findings.
The p value that is calculated for the t-test is dependent on several factors including sample size and effect size. It is very likely that, given the small effect size obtained, if the sample size was smaller the study would have yielded statistically significant results. Therefore, it appears that the low statistical power (i.e., high Type II error) of the study resulting from the large sample size was mainly responsible for the lack of significant findings.
The p value that is calculated for the t-test is dependent on several factors including sample size and effect size. It is very likely that, given the effect size obtained, if the sample size was smaller the study would have yielded statistically significant results. Therefore, it appears that the low statistical power (i.e., high Type II error) of the study resulting from the large sample size was mainly responsible for the lack of significant findings.
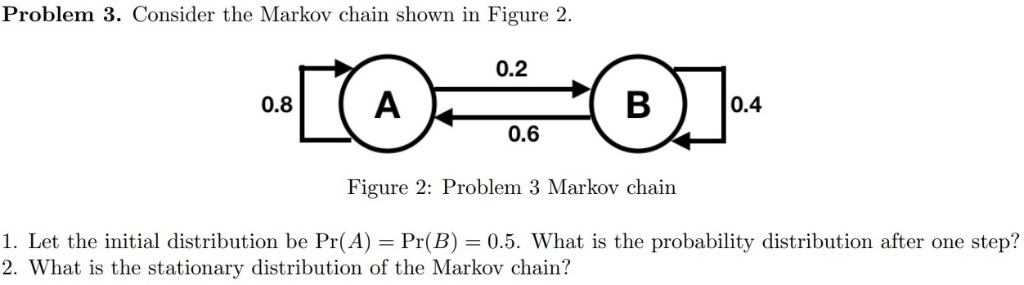
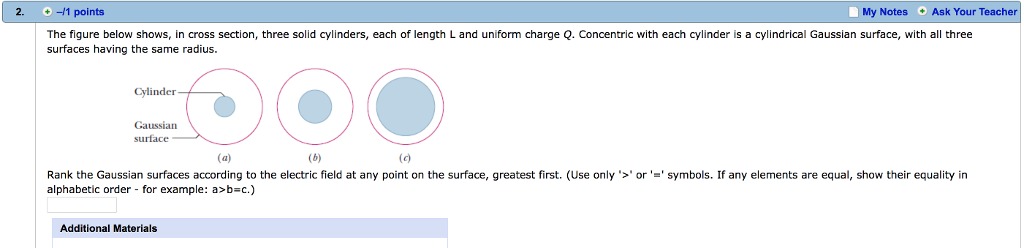
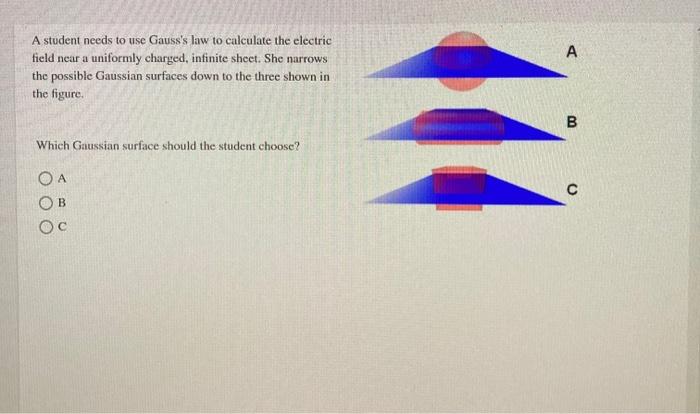
Problem 3. Consider the Markov chain shown in Figure 2. Figure 2: Problem 3 Markov chain 1. Let the initial distribution be Pr(A) : Pr(B) = 0.5. What is the probability distribution after one step? 2. What is the stationary distribution of the Markov chain? 2. -/1 points My Notes . Ask Your Teacher The figure below shows, in cross section, three solid cylinders, each of length L and uniform charge Q. Concentric with each cylinder is a cylindrical Gaussian surface, with all three surfaces having the same radius. Cylinder Gaussian surface (a) (6) (c) Rank the Gaussian surfaces according to the electric field at any point on the surface, greatest first. (Use only '>' or '=' symbols. If any elements are equal, show their equality in alphabetic order - for example: a>b=c.) Additional MaterialsA student needs to use Gauss's law to calculate the electric field near a uniformly charged, infinite sheet. She narrows A the possible Gaussian surfaces down to the three shown in the figure. B Which Gaussian surface should the student choose? OA C OB Oc
Step by Step Solution
There are 3 Steps involved in it

Get step-by-step solutions from verified subject matter experts