

Question: Question: Considering both the probability value and effect size measure, what interpretations would you make about the findings? That is, what are your conclusions about
Question:
Considering both the probability value and effect size measure, what interpretations would you make about the findings? That is, what are your conclusions about the effects of leaving happy faces on checks?
Recall again that Rind & Bordia (1996) investigated whether or not drawing a happy face on customers' checks increased the amount of tips received by a waitress at an upscale restaurant on a universitycampus. Duringthelunchhourawaitressdrewahappy,smilingfaceonthechecksofa randomhalfofhercustomers. Theremaininghalfofthecustomersreceivedacheckwithnodrawing(18 points).
The tip percentages for the control group (no happy face) are as follows:
45% 39% 36% 34% 34% 33% 31% 31% 30% 30% 28% 28% 28% 27% 27% 25% 23% 22% 21% 21% 20% 18% 8%
The tip percentages for the experimental group (happy face) are as follows:
72% 65% 47% 44% 41% 40% 34% 33% 33% 30% 29% 28% 27% 27% 25% 24% 24% 23% 22% 21% 21% 17%
Group of answer choices
The p value that is calculated for the t-test is dependent on several factors including sample size and effect size. It is very likely that, given the effect size obtained, if the sample size was larger the study would have yielded statistically significant results. Therefore, it appears that the low statistical power (i.e., high Type II error) of the study resulting from the small sample size was probably mainly responsible for the lack of significant findings.
The p value that is calculated for the t-test is dependent on one factor: sample size. It is very likely that, given the large effect size obtained, if the sample size was larger the study would have yielded statistically significant results. Therefore, it appears that the strong statistical power of the study resulting from the small sample size was mainly responsible for the lack of significant findings.
The p value that is calculated for the t-test is dependent on several factors including sample size and effect size. It is very likely that, given the small effect size obtained, if the sample size was smaller the study would have yielded statistically significant results. Therefore, it appears that the low statistical power (i.e., high Type II error) of the study resulting from the large sample size was mainly responsible for the lack of significant findings.
The p value that is calculated for the t-test is dependent on several factors including sample size and effect size. It is very likely that, given the effect size obtained, if the sample size was smaller the study would have yielded statistically significant results. Therefore, it appears that the low statistical power (i.e., high Type II error) of the study resulting from the large sample size was mainly responsible for the lack of significant findings.
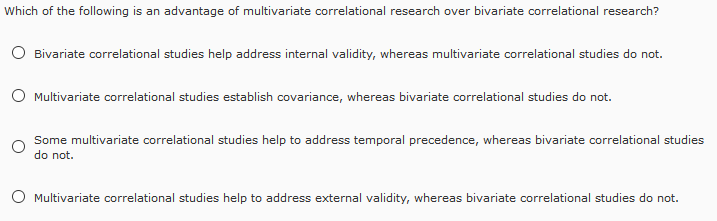
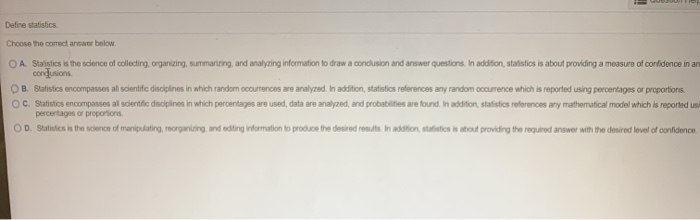
Which of the following is an advantage of multivariate correlational research over bivariate correlational research? O Bivariate correlational studies help address internal validity, whereas multivariate correlational studies do not. Multivariate correlational studies establish covariance, whereas bivariate correlational studies do not. O Some multivariate correlational studies help to address temporal precedence, whereas bivariate correlational studies do not. Multivariate correlational studies help to address external validity, whereas bivariate correlational studies do not.Define statistics Choose the correct answer bolow, O A. Statistics is the science of collecting, organizing, summarizing, and analyzing information to draw a conclusion and answer questions, In addition, statistics is about providing a measure of confidence in an congusions. Q)B. Statistics encompasses all scientific disciplines in which random occurrences are analyzed. In addition, statistics references any random occurrence which is reported using percentages or proportions. (Q) C. Statistics encompasses all scientific disciplines in which percentages are used, data are analyzed, and probabilities are found. In addition, statistics references any mathematical model which is reported us. percentages or proportions, O D. Statistics is the sdenon of manipulating, reorganizing, and editing information to produce the desired results, In addition, statistics is about providing the requited answer with the desired level of confidenon
Step by Step Solution
There are 3 Steps involved in it

Get step-by-step solutions from verified subject matter experts