

Question: Question: Considering both the probability value and effect size measure, what interpretations would you make about the findings? That is, what are your conclusions about

Question:
Considering both the probability value and effect size measure, what interpretations would you make about the findings? That is, what are your conclusions about the effects of leaving happy faces on checks?
Recall again that Rind & Bordia (1996) investigated whether or not drawing a happy face on customers' checks increased the amount of tips received by a waitress at an upscale restaurant on a universitycampus. Duringthelunchhourawaitressdrewahappy,smilingfaceonthechecksofa randomhalfofhercustomers. Theremaininghalfofthecustomersreceivedacheckwithnodrawing(18 points).
The tip percentages for the control group (no happy face) are as follows:
45% 39% 36% 34% 34% 33% 31% 31% 30% 30% 28% 28% 28% 27% 27% 25% 23% 22% 21% 21% 20% 18% 8%
The tip percentages for the experimental group (happy face) are as follows:
72% 65% 47% 44% 41% 40% 34% 33% 33% 30% 29% 28% 27% 27% 25% 24% 24% 23% 22% 21% 21% 17%
Group of answer choices
The p value that is calculated for the t-test is dependent on several factors including sample size and effect size. It is very likely that, given the effect size obtained, if the sample size was larger the study would have yielded statistically significant results. Therefore, it appears that the low statistical power (i.e., high Type II error) of the study resulting from the small sample size was probably mainly responsible for the lack of significant findings.
The p value that is calculated for the t-test is dependent on one factor: sample size. It is very likely that, given the large effect size obtained, if the sample size was larger the study would have yielded statistically significant results. Therefore, it appears that the strong statistical power of the study resulting from the small sample size was mainly responsible for the lack of significant findings.
The p value that is calculated for the t-test is dependent on several factors including sample size and effect size. It is very likely that, given the small effect size obtained, if the sample size was smaller the study would have yielded statistically significant results. Therefore, it appears that the low statistical power (i.e., high Type II error) of the study resulting from the large sample size was mainly responsible for the lack of significant findings.
The p value that is calculated for the t-test is dependent on several factors including sample size and effect size. It is very likely that, given the effect size obtained, if the sample size was smaller the study would have yielded statistically significant results. Therefore, it appears that the low statistical power (i.e., high Type II error) of the study resulting from the large sample size was mainly responsible for the lack of significant findings.
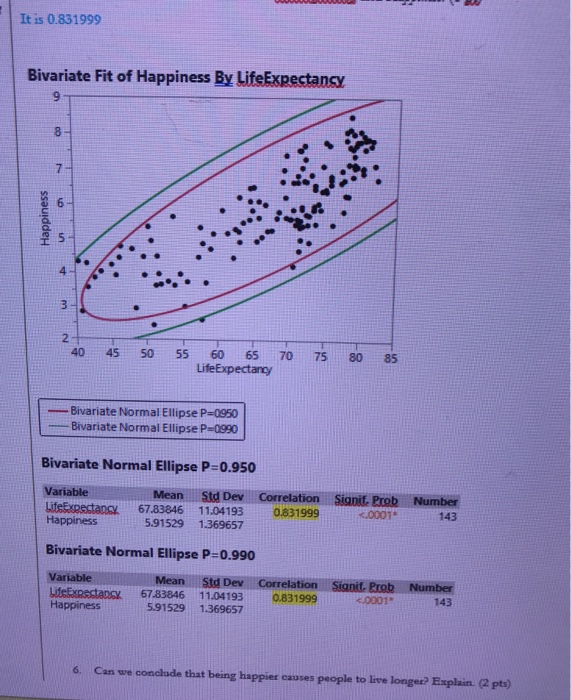
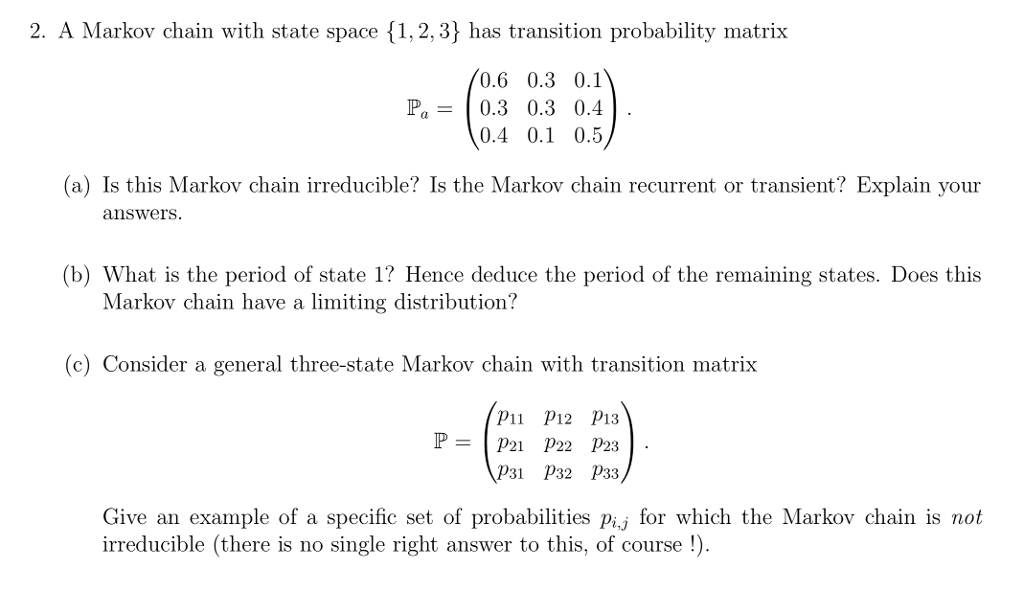
Bivariate Distributions What is the bivariate probability density function (pdf) and its properties? Marginal, joint, and conditional distributions Expected values and variance calculation in bivariate distributions Marginal, joint, and conditional expectations CovarianceIt is 0.831999 Bivariate Fit of Happiness By LifeExpectancy Happiness un 40 45 50 55 60 65 70 80 85 LifeExpectancy Bivariate Normal Ellipse P=0950 Bivariate Normal Ellipse P=0990 Bivariate Normal Ellipse P=0.950 Variable Mean Std Dev Correlation Signit. Prob Number LifeExpectancy 67.83646 11.04193 0.631999 <.0001 happiness bivariate normal ellipse p="0.990" variable mean std dev correlation signit. prob number lifeexpectancy can we conclude that being happier causes people to live longer explain. pts a markov chain with state space has transition probability matrix a: is this irreducible the recurrent or transient explain your answers. what period of hence deduce remaining states. does have limiting distribution consider general three-state p22 p23 p32 p33 give an example specic set probabilities jag- for which not no single right answer this1 course l>
Step by Step Solution
There are 3 Steps involved in it

Get step-by-step solutions from verified subject matter experts