

Question: Question Help The table below shows the frequency distribution of the rainfall on 52 consecutive Fridays in a certain city. Use the frequency distribution to
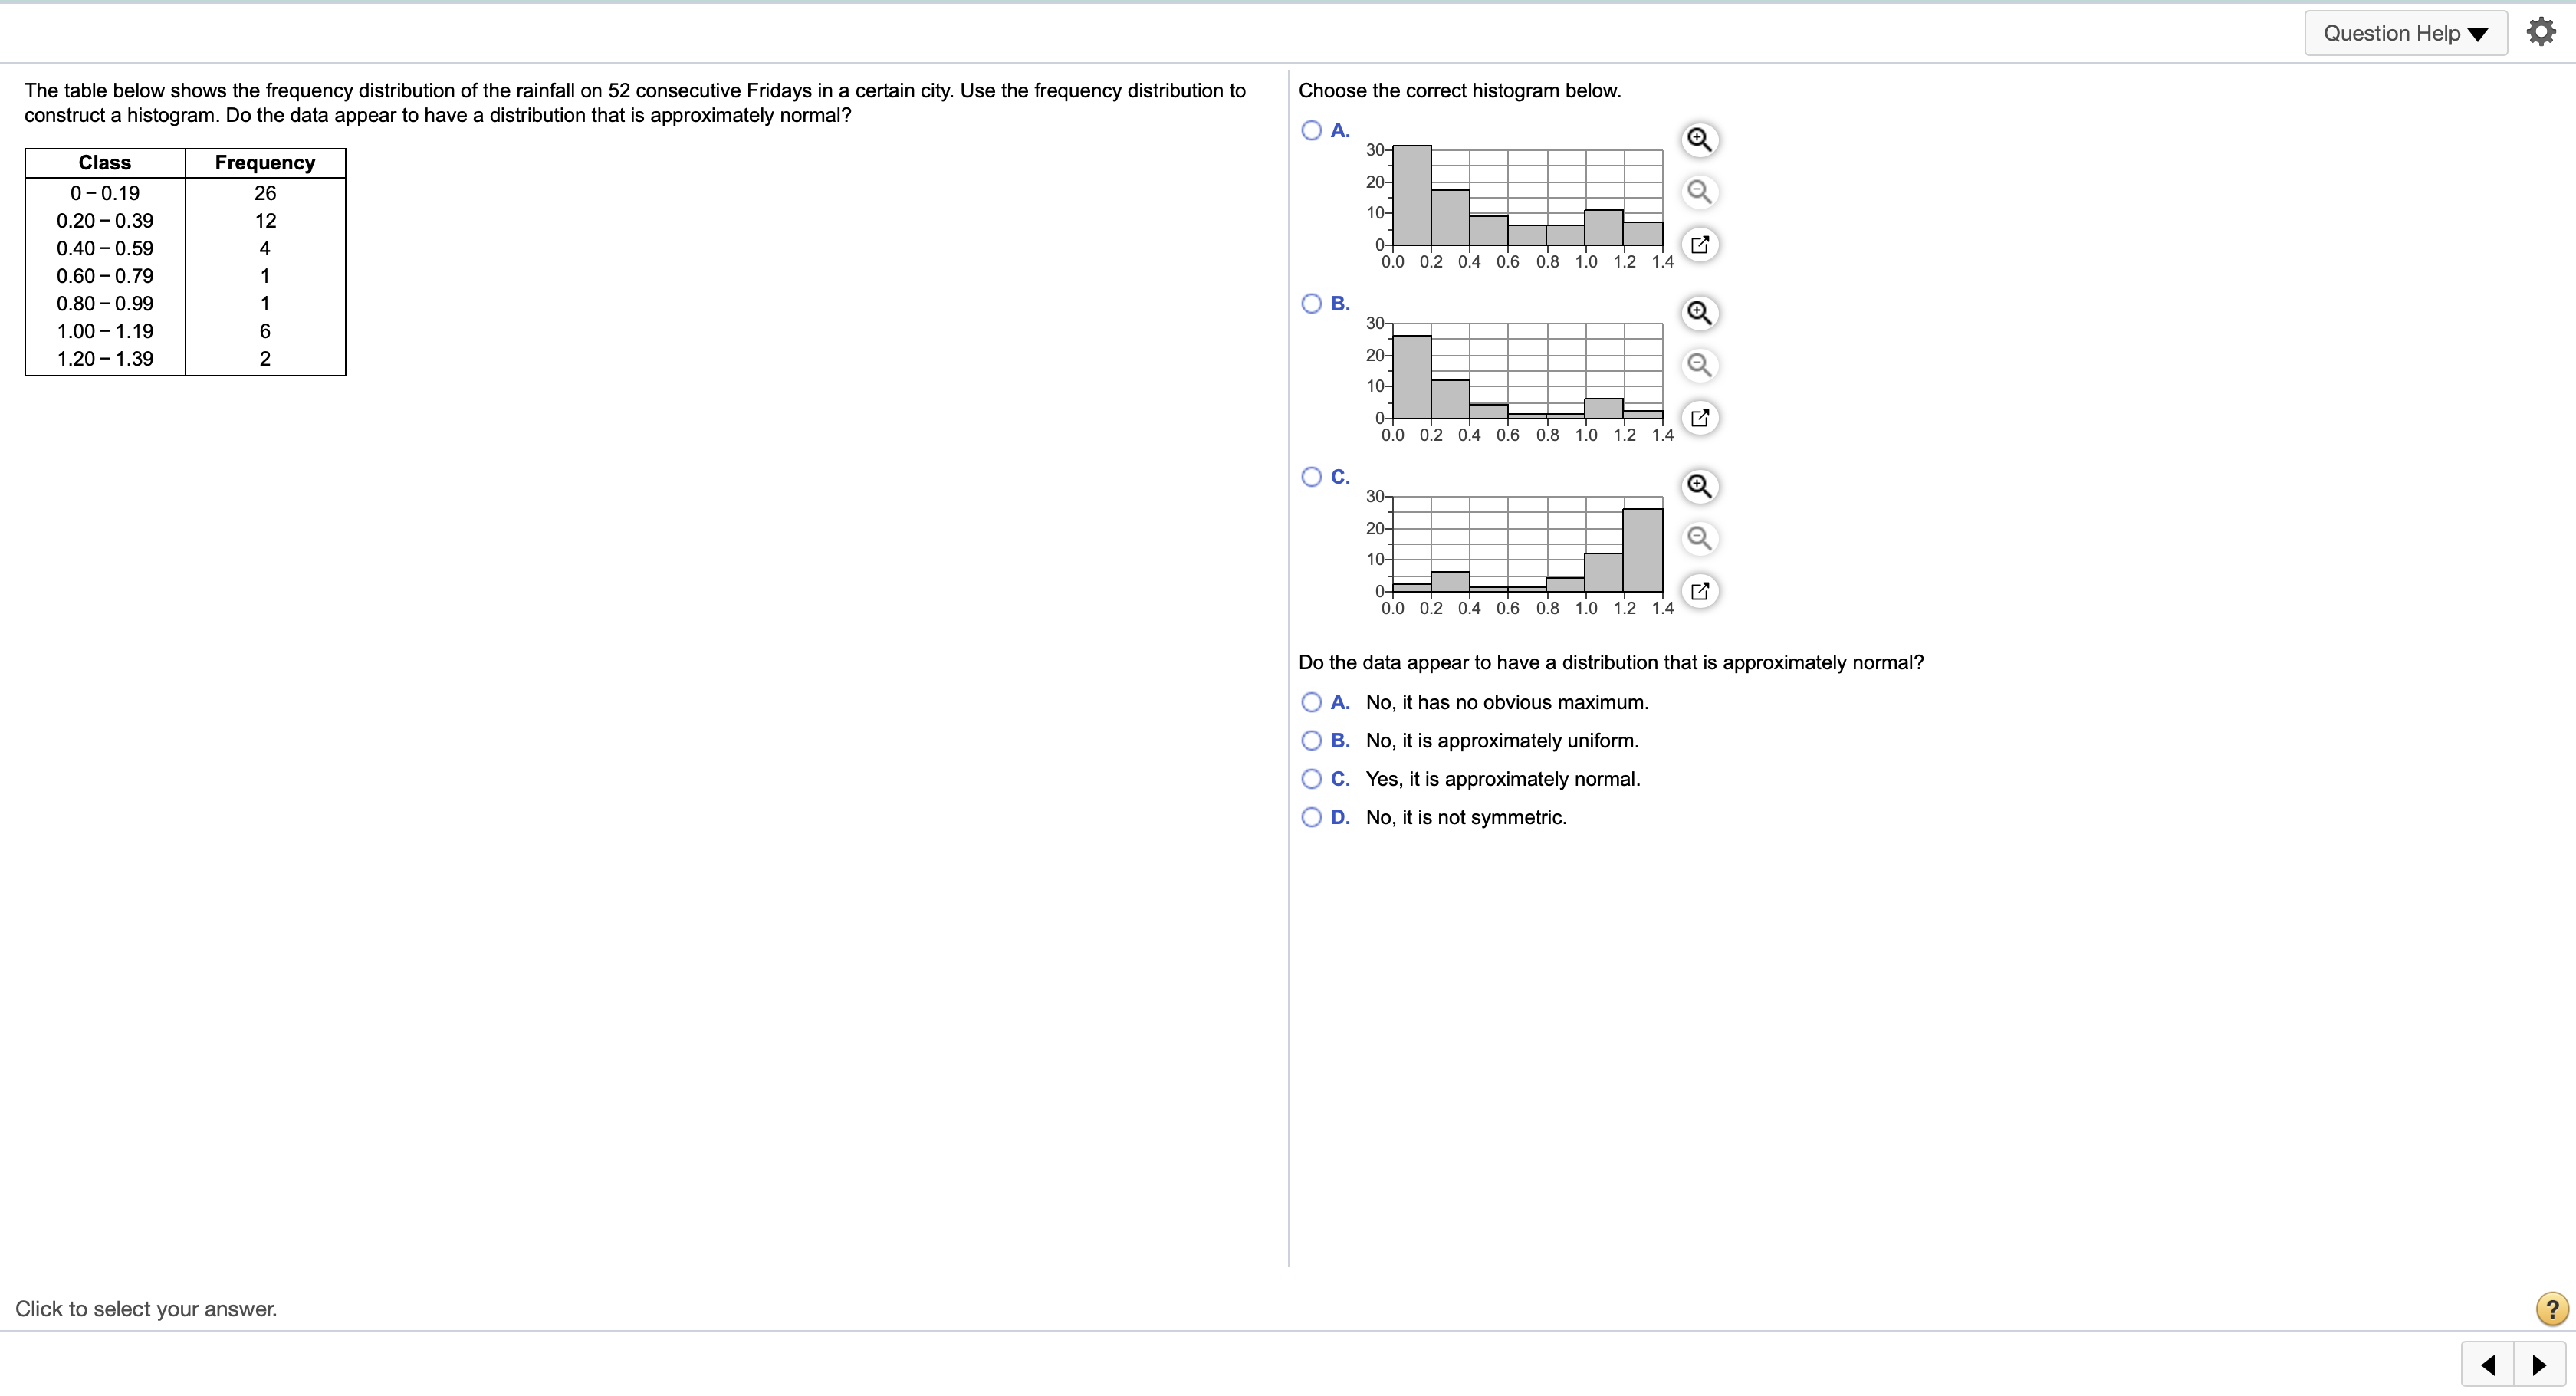
Question Help The table below shows the frequency distribution of the rainfall on 52 consecutive Fridays in a certain city. Use the frequency distribution to Choose the correct histogram below. construct a histogram. Do the data appear to have a distribution that is approximately normal? O A. 30- Class Frequency 20- 0 - 0.19 26 0 0.20 - 0.39 12 0.40 - 0.59 0.0 0.2 0.4 0.6 0.8 1.0 1.2 1.4 0.60 - 0.79 0.80 - 0.99 O B. NO- - 1.00 - 1.19 30- 1.20 - 1.39 20- O 0- 0.0 0.2 0.4 0.6 0.8 1.0 1.2 O C. 30- 20- 10- of 0.0 0.2 0.4 0.6 0.8 1.0 1.2 1:4 Do the data appear to have a distribution that is approximately normal? O A. No, it has no obvious maximum. O B. No, it is approximately uniform. O C. Yes, it is approximately normal. O D. No, it is not symmetric. Click to select your answer. ? 4
Step by Step Solution
There are 3 Steps involved in it

Get step-by-step solutions from verified subject matter experts