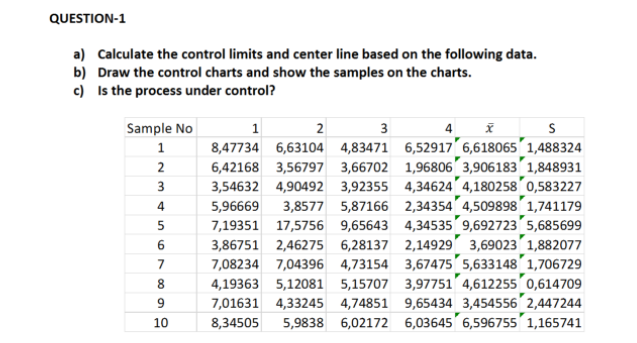
Question: QUESTION-1 a) Calculate the control limits and center line based on the following data. b) Draw the control charts and show the samples on the

QUESTION-1 a) Calculate the control limits and

QUESTION-1 a) Calculate the control limits and center line based on the following data. b) Draw the control charts and show the samples on the charts. c) Is the process under control? Sample No 1 2 3 4 5 1 2 3 4. s 8,47734 6,63104 4,83471 6,52917' 6,618065' 1,488324 6,42168 3,56797 3,66702 1,96806 3,906183 1,848931 3,54632 4,90492 3,92355 4,34624 4,180258 0,583227 5,96669 3,8577 5,87166 2,34354' 4,509898' 1,741179 7,19351 17,5756 9,65643 4,34535 9,692723' 5,685699 3,86751 2,46275 6,28137 2,149293,69023 1,882077 7,08234 7,04396 4,73154 3,67475' 5,633148' 1,706729 4,19363 5,12081 5,15707 3,97751' 4,6122550,614709 7,01631 4,33245 4,74851 9,65434 3,454556' 2,447244 8,34505 5,9838 6,02172 6,03645 6,596755 1,165741 6 7 8 D00 10

Step by Step Solution

There are 3 Steps involved in it

1 Expert Approved Answer
Step: 1 Unlock blur-text-image
Question Has Been Solved by an Expert!

Get step-by-step solutions from verified subject matter experts

Step: 2 Unlock
Step: 3 Unlock

Students Have Also Explored These Related General Management Questions!