

Question: Questions Problem 1 7 - 2 8 Algo ( Constructing Control Charts ) Question 2 c 1 . 2 . 3 . 4 . 5
Questions
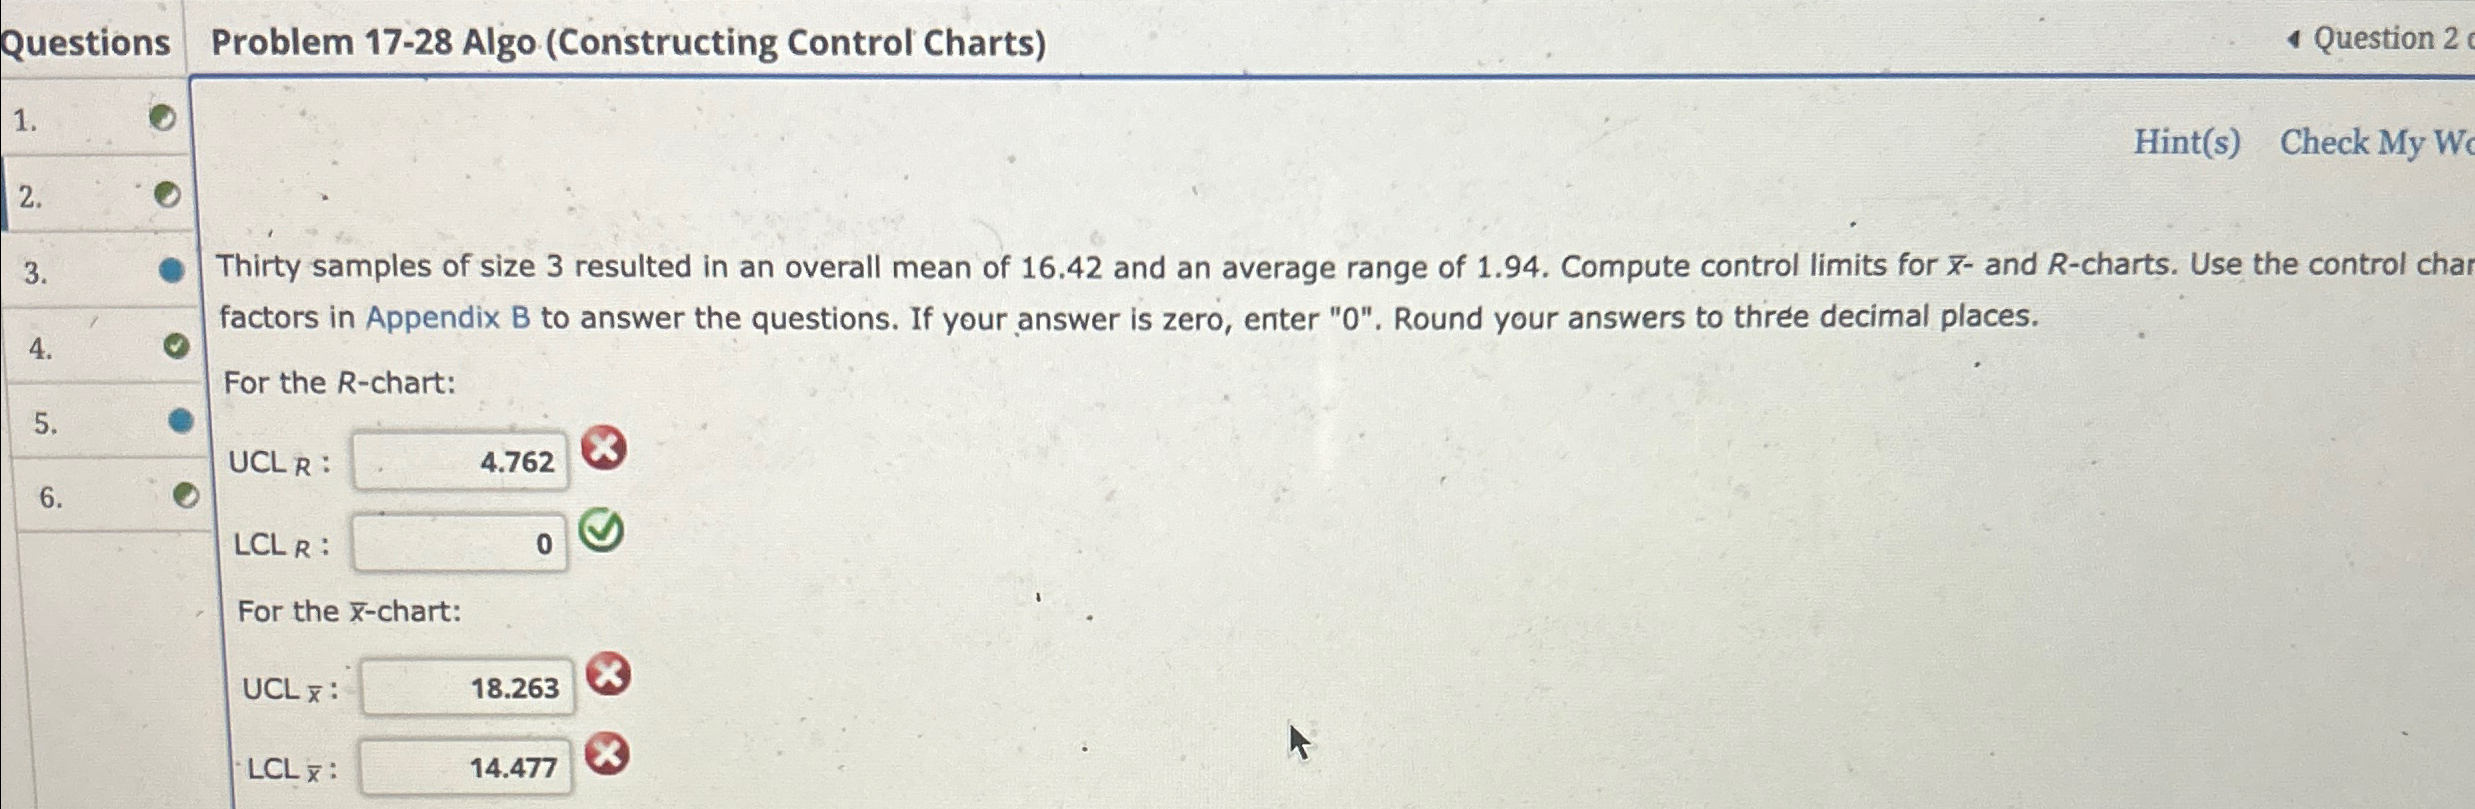
Problem Algo Constructing Control Charts
Question c
Thirty samples of size resulted in an overall mean of and an average range of Compute control limits for and charts. Use the control char factors in Appendix B to answer the questions. If your answer is zero, enter Round your answers to three decimal places.
For the chart:
:
For the chart:
:
:
Step by Step Solution
There are 3 Steps involved in it
1 Expert Approved Answer
Step: 1 Unlock

Question Has Been Solved by an Expert!
Get step-by-step solutions from verified subject matter experts
Step: 2 Unlock
Step: 3 Unlock