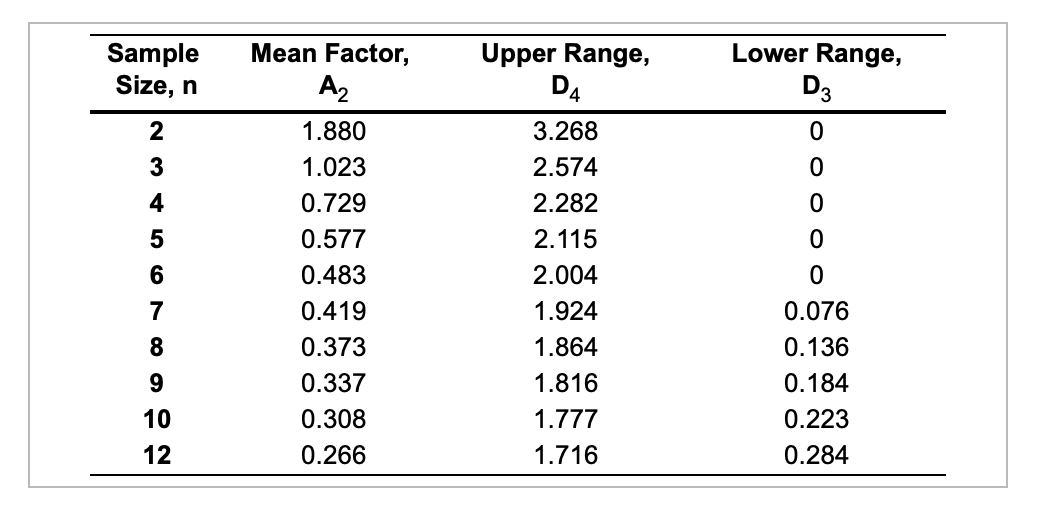
Question: Refer to Table S6.1 - Factors for Computing Control Chart Limits (3 sigma)for this problem. Table S6.1 - Factors for Computing Control Chart Limits (3
Refer to Table S6.1 - Factors for Computing Control Chart Limits (3 sigma)for this problem.
Table S6.1 - Factors for Computing Control Chart Limits (3 sigma)

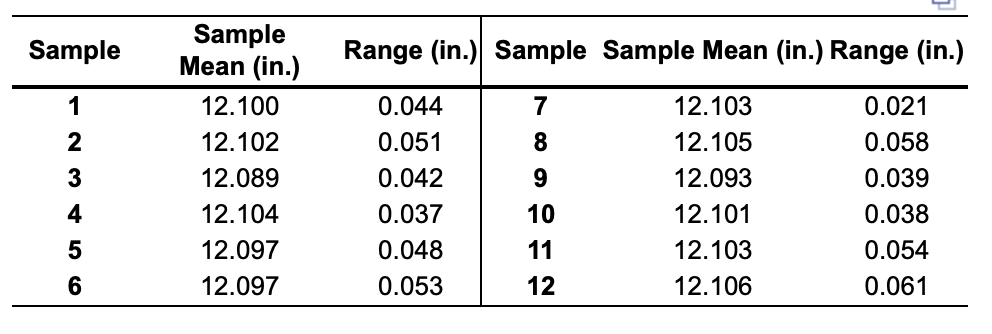
Twelve samples, each containing five parts, were taken from a process that produces steel rods at Emmanual Kodzi's factory. The length of each rod in the samples was determined. The results were tabulated and sample means and ranges were computed. The results were:

THE QUESTIONS

Sample Size, n Lower Range, D3 2 0 3 0 4 0 5 0 Mean Factor, Az 1.880 1.023 0.729 0.577 0.483 0.419 0.373 0.337 0.308 0.266 Upper Range, D4 3.268 2.574 2.282 2.115 2.004 1.924 1.864 1.816 1.777 1.716 6 0 7 8 9 0.076 0.136 0.184 0.223 0.284 10 12 Sample Range (in.) Sample Sample Mean (in.) Range (in.) 1 7 2 8 Sample Mean (in.) 12.100 12.102 12.089 12.104 12.097 12.097 3 0.044 0.051 0.042 0.037 0.048 0.053 7 8 9 1 12 12.103 12.105 12.093 12.101 12.103 12.106 0.021 0.058 0.039 0.038 0.054 0.061 4 10 5 11 6 = For the given data, the x = inches (round your response to four decimal places). Based on the sampling done, the control limits for 3-sigma x chart are: Upper Control Limit (UCL;) = = inches (round your response to four decimal places). Lower Control Limit (LCL:) = = inches (round your response to four decimal places). Based on the x-chart, is one or more samples beyond the control limits? Yes or no For the given data, the R = inches (round your response to four decimal places). The control limits for the 3-sigma R-chart are: Upper Control Limit (UCLR) = = inches (round your response to four decimal places). Lower Control Limit (LCLR) = = inches (round your response to four decimal places). Based on the R-chart, is one or more samples beyond the control limits? Yes or no